
The Same Pill, A Different Price
Issue #2 — The American Healthcare Conundrum

The American Healthcare Conundrum is an investigative data journalism project. Each issue identifies one fixable problem in the US healthcare system, quantifies the waste, and recommends a specific solution. We publish the code. We publish the methodology. We publish the caveats. Anyone can check our work.
SAVINGS TRACKER
The target: close the ~$3 trillion annual gap between what the US and Japan
spend per person on healthcare. Japan: highest life expectancy, lowest
infant mortality in the OECD — at roughly half our price tag.

Full scale  ($0 ──────────────────────────────────────────── $3T):
            ▓░░░░░░░░░░░░░░░░░░░░░░░░░░░░░░░░░░░░░░░░░░░░░░  0.87%
            ↑ $25.6B — everything identified through Issue #2

Zoomed in to first $100B (1/30 of scale — see chart above for detail):
 Issue #1  ░  $0.6B    OTC Drug Overspending
 Issue #2  ████████████████████████  +$25.0B  Brand Drug Price Differentials
           ──────────────────────────────────────────────────────────
           Running total: $25.6B · 2 issues published · $2,974B remaining
One Drug, Two Prices
Go to a pharmacy in Tokyo. Pick up apixaban — a blood thinner prescribed to prevent strokes. The Japanese government negotiates the price of every drug sold in the country. Your 30-day supply costs roughly $22.
Now go to an American pharmacy. Pick up Eliquis, the branded version of the same molecule. Medicare pays an average of $862.
Same drug. Same dose. Same active ingredient synthesized the same way. Thirty-nine times the price.
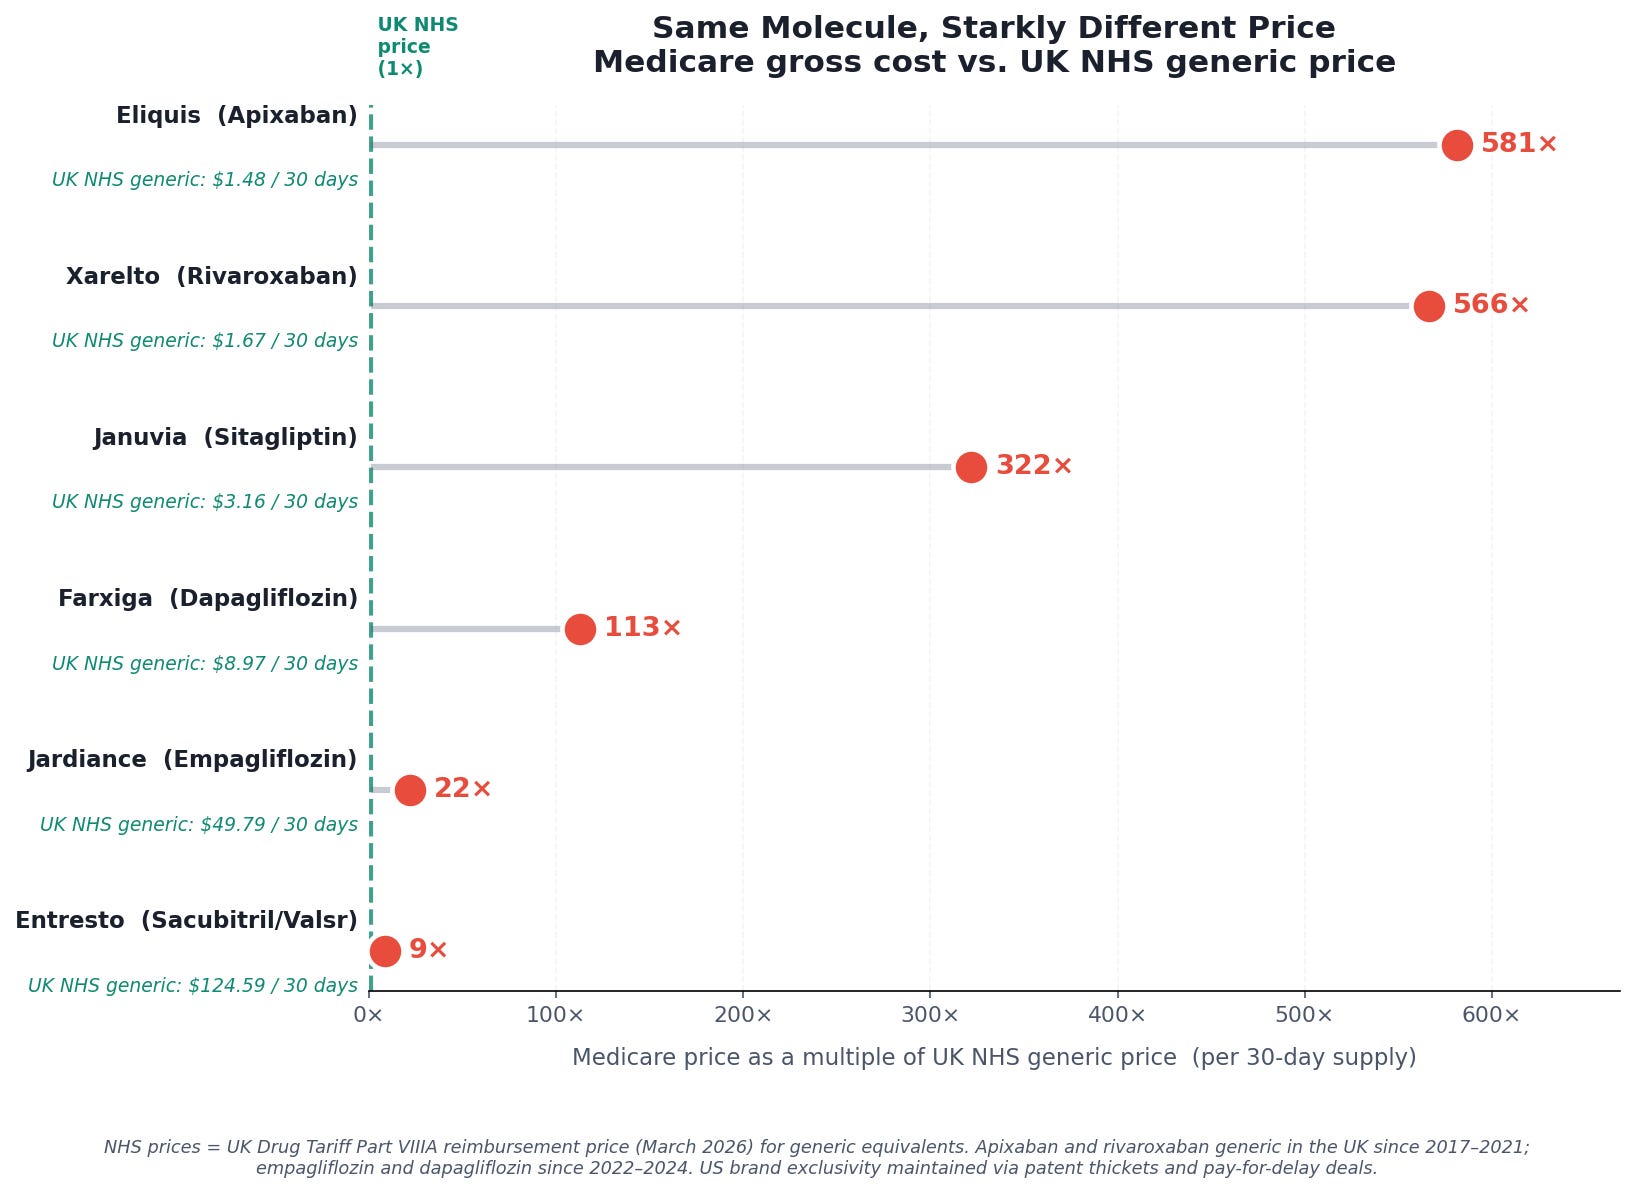
And that’s Japan. In the United Kingdom, apixaban has been available as a generic since 2017. The NHS reimburses pharmacies roughly £1.17 — about $1.48 — for a 30-day supply. In the US, Bristol-Myers Squibb and Pfizer have used a thicket of secondary patents and pay-for-delay settlements to block generic entry, so Medicare still pays the branded price: 581 times more for the same molecule.
Eliquis is the single most expensive drug in Medicare Part D, the federal program that covers prescription drugs for roughly 50 million Americans over 65 and those with disabilities. In 2023, it cost the program $18.3 billion. (By 2024, that figure had risen to $20.8 billion — and the drug showed no signs of slowing down.) The National Cancer Institute — the federal agency responsible for cancer research, prevention, and treatment — had a total budget of $7.2 billion that year. Eliquis cost Medicare more than twice what the country invests in fighting cancer. The National Science Foundation, which funds basic scientific research across every discipline, received $9.5 billion. One blood thinner cost more than the NCI and NSF combined. One drug. One year.
This is not an argument against pharmaceutical innovation. The companies that developed apixaban invested real capital and took real risk. But the original patents on apixaban expired years ago in most of the world. What keeps the American price at $862 while the rest of the world pays $22–$59 is not ongoing R&D — it is a system of secondary patents, legal settlements, and regulatory strategies designed to extend market exclusivity long after the original invention was paid for. That system is the story of this issue.
Two things have started to change. The Inflation Reduction Act of 2022 authorized Medicare to negotiate prices for the first time, and the first negotiated prices — including for Eliquis — took effect January 1, 2026. Those negotiations brought real reductions, and we’ll quantify them below. But even after negotiation, the gap between what Medicare pays and what every other wealthy nation pays remains enormous. Understanding why requires looking at the data.
The Data
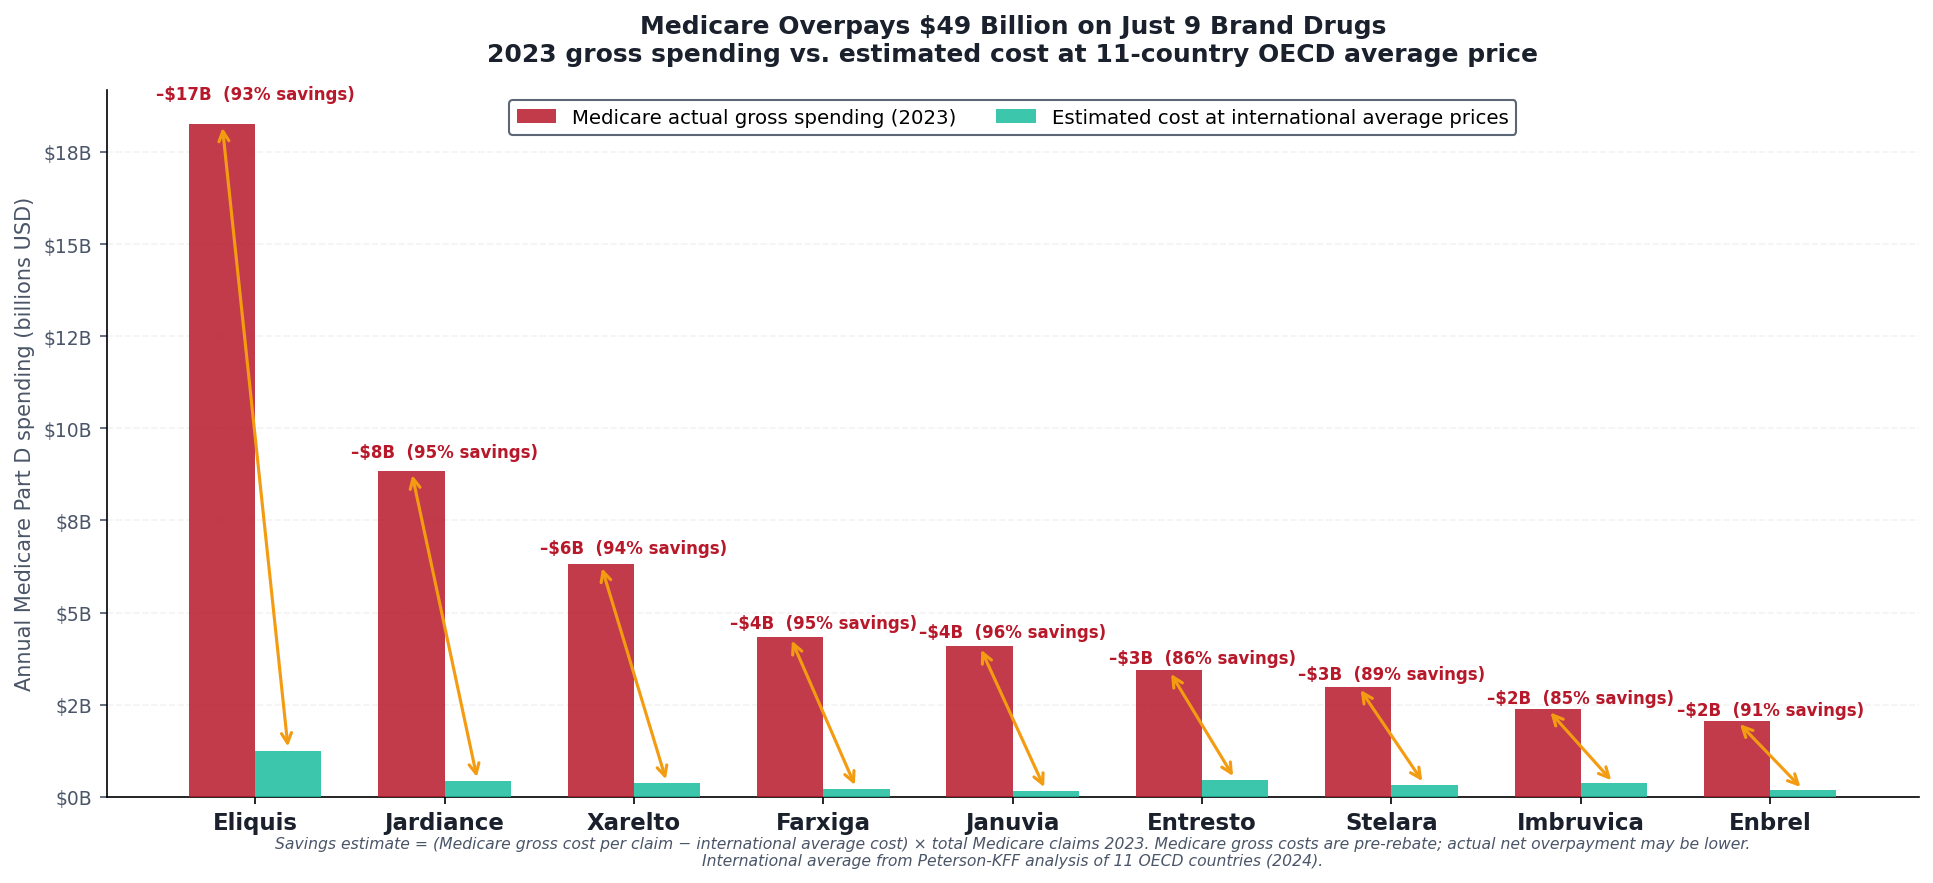
Using CMS Medicare Part D spending data for 2023, we matched the nine highest-spend brand drugs in the program against two sets of international reference prices: the international average from Peterson-KFF's analysis of eleven OECD nations, and the UK NHS Drug Tariff — Britain's published reimbursement schedule, downloaded directly and available in our GitHub repository.
The price comparisons in the charts and in the drug-by-drug breakdown below are per 30-day supply — what it costs to fill one prescription. The aggregate dollar figures ($52.7 billion, $18.3 billion for Eliquis alone) are annual Medicare totals across all claims for those drugs in 2023. Both are real numbers; they measure different things.
For the nine drugs examined:
$52.7 billion in 2023 Medicare Part D spending
International average price: roughly 7–26× below what Medicare pays
UK NHS price (for those with generics available): 22–581× below Medicare gross
Estimated savings if Medicare paid the international average: $48.9 billion gross, before rebates. After adjusting for the confidential manufacturer rebates that reduce Medicare’s actual net cost (see methodology below), the addressable savings are approximately $25 billion per year — still larger than the entire budget of the National Institutes of Health
The conservative figure accounts for manufacturer rebates — payments from drug companies back to Medicare Part D plans that reduce the net cost below the gross figures in public data. CMS publishes gross spending by drug, but individual rebate amounts are legally protected as trade secrets under contracts between manufacturers and pharmacy benefit managers. No public dataset shows the exact net price of Eliquis or Jardiance. So we triangulate. MedPAC — Congress’s independent advisory body, which has statutory access to confidential rebate data under the Consolidated Appropriations Act of 2021 — reports that aggregate Part D rebates reached approximately $70 billion in 2023, or 25 percent of gross spending. That average includes generics, which carry near-zero rebates. For brand drugs specifically, the rebate share is substantially higher: Feldman et al. (JAMA Health Forum, 2021) estimated brand-name Part D discounts at 37 percent as of 2018 and rising, with some therapeutic classes exceeding 50 percent. The $25 billion figure in this analysis applies a 49 percent net adjustment — consistent with CMS’s own gross-to-net reconciliation for top-spend branded products and with MedPAC’s brand-specific ranges. Even after that adjustment, the gap between what Medicare pays and what peer nations pay is measured in the tens of billions.
A note on why these numbers are hard to pin down: the rebate system’s opacity is not incidental — it is structural, and it is the subject of Issue #4 in this series. The companies that negotiate rebates on behalf of Medicare plans are called pharmacy benefit managers. They process 80 percent of American prescriptions, and the confidentiality provisions that keep rebate data hidden are the mechanism by which they retain billions in value. More on that soon.
The nine drugs — Eliquis, Jardiance, Xarelto, Farxiga, Januvia, Entresto, Stelara, Imbruvica, and Enbrel — are not obscure. They are the drugs filling the most Medicare claims for the most common conditions: heart disease, diabetes, heart failure, autoimmune disease. They are, collectively, the financial center of gravity of Medicare Part D.
The Pattern, Drug by Drug
Eliquis is the most dramatic example, but every drug on the list tells the same story.
Xarelto (rivaroxaban), another blood thinner for the same atrial fibrillation indication — $948 per 30-day Medicare claim. The UK NHS pays roughly £1.32 — about $1.67 — for a 30-day supply of the identical molecule. A 566-fold difference.
Januvia (sitagliptin), a type 2 diabetes pill taken by millions of Medicare beneficiaries — $1,015 per Medicare claim, $3.16 in the UK. 321 times more expensive.
Farxiga (dapagliflozin) — $1,010 per Medicare claim, $9.00 in the UK. 112 times more expensive.
For each of these drugs, the molecule is off-patent in the United Kingdom. Generic manufacturers entered the market years ago. British patients pay commodity prices for what American Medicare still treats as a branded luxury.
The drugs where the gap is smaller — Entresto at 8.6 times the NHS price, Stelara and Enbrel at 7–11 times the international average — are either still under active patent globally, or are biologics with genuine manufacturing complexity. Even there, the premium that the US pays over peer nations has no equivalent anywhere else in the developed world.
How Is This Possible?
The standard explanation is that American patients subsidize global pharmaceutical innovation. Companies charge high prices in the US because other governments impose price controls; the US revenue funds the R&D that produces the next generation of drugs. Pay less, and you get fewer new drugs.
There is something to this argument. US revenue does represent a large share of pharmaceutical profits, and removing it entirely would affect investment decisions. The pharmaceutical industry is not wrong that price controls can distort incentives.
But the argument does not hold for apixaban. Or rivaroxaban. Or sitagliptin. These are not frontier molecules awaiting their payoff. Their patents expired years ago in most of the world. Generic manufacturers entered those markets, prices fell, and patients now pay commodity rates for the same active ingredients. The original R&D investment was recouped long ago — many times over. What Medicare is paying at this point is not funding the next breakthrough. It is the price of market exclusivity, maintained well past its expiration through patent thickets, pay-for-delay agreements, and evergreening — legal and regulatory tactics that keep generic competition off the American market long after it arrived everywhere else.
Patent thickets are networks of secondary patents — on formulations, manufacturing processes, delivery mechanisms, methods of use — that do not reflect new discoveries but do require generic manufacturers to litigate their way through years of infringement challenges before reaching patients. Pay-for-delay is exactly what it sounds like: brand manufacturers pay generic competitors to delay entry, settling litigation in ways that leave the brand protected.
These are not innovation. They are the legal infrastructure of price maintenance.
What RAND Found
The NHS prices show the floor — what happens when patents expire and competition arrives. But even for drugs that remain branded everywhere, the US pays dramatically more than peer nations that actually negotiate.
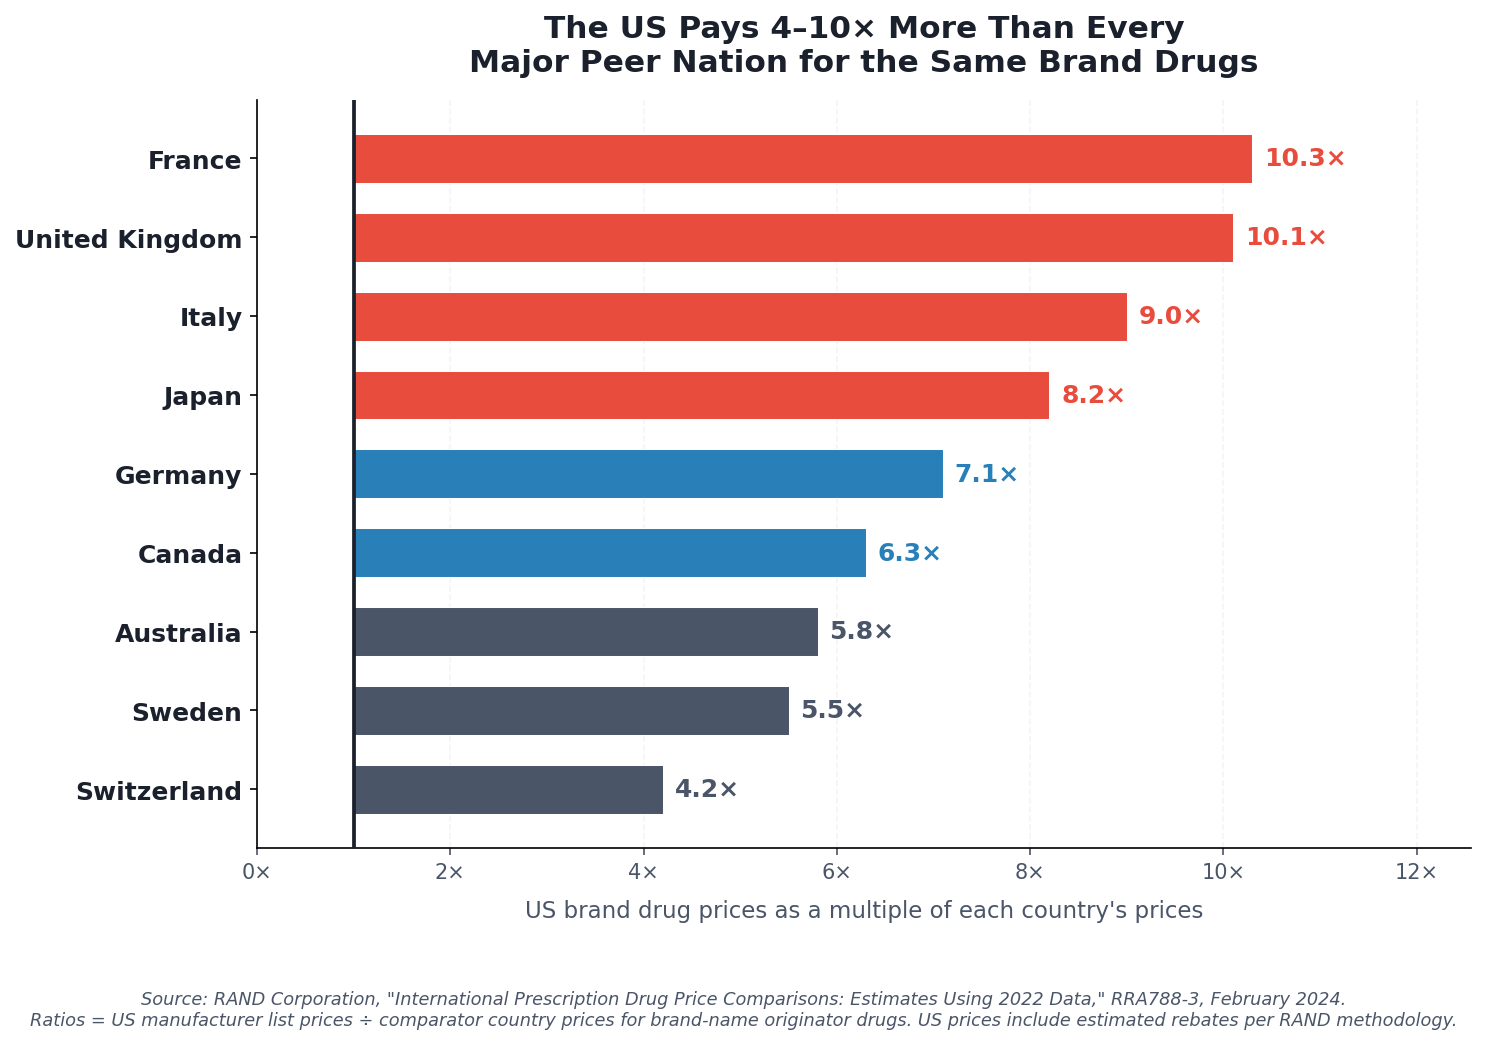
The RAND Corporation — a nonprofit research institution founded in 1948, originally created to provide independent analysis for the US government, and now widely regarded as one of the most rigorous non-partisan policy research organizations in the world — compared US brand-name drug prices against manufacturer pricing data across 33 OECD countries using 2022 data. Their findings:
US brand-name drug prices are, on average, 10.3 times what France pays, 10.1 times what the United Kingdom pays, 8.2 times what Japan pays, and 7.1 times what Germany pays. The overall multiple across all countries is 2.78×. For brand drugs specifically, the ratio rises to at least 3.22× — and that accounts for estimated US rebates.
These are not generic-versus-brand comparisons. Every country on that list pays for the same branded molecules. The difference is that every country on that list negotiates. The United States, for most drugs, does not — or did not, until recently.
What the IRA Started — And What It Did Not Finish
The Inflation Reduction Act of 2022 authorized Medicare to negotiate drug prices for the first time. The first ten drugs — a list that includes nine of the drugs analyzed in this issue — had negotiated prices take effect January 1, 2026.
The results are real. Eliquis dropped from a $521 per-unit list price to $231 negotiated. Jardiance from $573 to $197. Januvia from $527 to $113. These are the largest reductions in Medicare Part D pricing history.
They are also still far above what peer countries pay.
The Medicare negotiated price for Eliquis is $231. The international average across eleven OECD countries is $59. The IRA negotiated Eliquis to four times the global average. That is better than fourteen times the global average. It is still four times.
Januvia at $113 is still nearly three times the $39 international average. Xarelto at $197 is still three and a half times the $55 international average.
The IRA was a first step, and it matters. What comes next determines whether that first step becomes meaningful structural reform or remains a useful talking point while the underlying gap persists.
The Fix
The IRA established a precedent: Medicare can negotiate. The question is now scope and method.
The current IRA negotiation process uses domestic list prices as the starting point and produces negotiated prices through bilateral negotiation with manufacturers. The result is meaningful — but it starts from a number that is already 3–10 times international comparators, which constrains how far negotiation alone can travel.
The specific fix: CMS should benchmark Medicare drug price negotiations against a reference basket of international prices — specifically, the average of prices paid in Germany, France, Japan, the UK, and Australia, adjusted for purchasing power. This is sometimes called an "international reference pricing" system, and it has bipartisan precedent: the Trump administration proposed a version of it in 2020 (the Most Favored Nation rule), and the Biden administration has explored it as an expansion of IRA authority.
Applied to the 9 drugs in this analysis, at the 11-country OECD average price, the estimated savings to Medicare is approximately $25 billion per year — conservatively adjusted for rebates and net costs. That is not theoretical. It is the difference between what Medicare currently pays, and what every other wealthy government pays, for the same molecules.
Applied across all brand-name drugs in Medicare Part D — not just the top ten — the savings would be considerably larger. CBO has estimated that aggressive expansion of Medicare drug price negotiation could save $500 billion or more over a decade. The methodology matters, but the order of magnitude is not in dispute.
Estimated annual savings from international reference pricing on high-spend brand drugs: $25 billion.
For comparison: that is roughly 2.5 times the annual budget of the CDC. Or, since this newsletter has a Japanese benchmark — it is the kind of money that would actually start to close the gap between what America spends on healthcare and what it gets for it.
A Note on Methodology
Several important caveats apply to the price comparisons in this issue.
The Medicare figures are gross costs from the Part D Public Use File — the price before manufacturer rebates flow back to Part D plans. Actual net Medicare spending is lower, typically by 25–30 percent for branded drugs. All estimates in this issue assume the rebate discount and use conservative net-cost figures where possible.
International prices come from two sources: Peterson-KFF's published comparison of eleven OECD countries (2024), and the NHS Drug Tariff Part VIIIA (March 2026), downloaded directly. Exchange rates use current GBP/USD. For drugs available as generics in the UK, the NHS price reflects generic reimbursement — the price of the same active ingredient after patent expiry, not the original branded price. This is intentional: the UK NHS prices show what the molecule actually costs when manufacturers compete on price rather than exclusivity.
All code, crosswalk logic, and supporting data files are published at github.com/rexrodeo/american-healthcare-conundrum.
If You Missed Issue #1
This issue is part of an ongoing series. Issue #1 covered the $2 billion Medicare Part D spends every year on prescription drugs with over-the-counter equivalents — 83 million claims for heartburn pills, allergy sprays, and pain relievers you can buy off the shelf for a fraction of the price. The fix there is administrative: OTC-equivalent step therapy through CMS guidance, no new legislation required. If you found this issue through search or a share, it's worth a read.
Next Issue
Nine drugs. $52.7 billion. That is the prescription drug story.
But the prescription drug story is only one chapter. The larger story is what happens when you actually need the hospital.
Issue #3 examines hospital pricing — specifically, the gap between what commercial insurers pay US hospitals and what peer countries pay for identical procedures. A hip replacement costs commercial insurers $29,000 in the United States. In Germany, the same surgery costs roughly $15,000. In Spain, $9,000. The gap is not explained by technology, surgeon quality, or outcomes — the US does not lead on any of those measures.
That gap runs through every major procedure in American medicine. We're going to put numbers on it.
If you want to follow the code: github.com/rexrodeo/american-healthcare-conundrum
If you want to push back on the methodology: reply to this email, or leave a comment below if you're reading on the web or app.
If you know a CMS official, a health economist, or a congressional staffer who should read this: forward it.
Savings Tracker — Running Total After Issue #2: ~$25.6 billion / ~$3 trillion (0.87%)
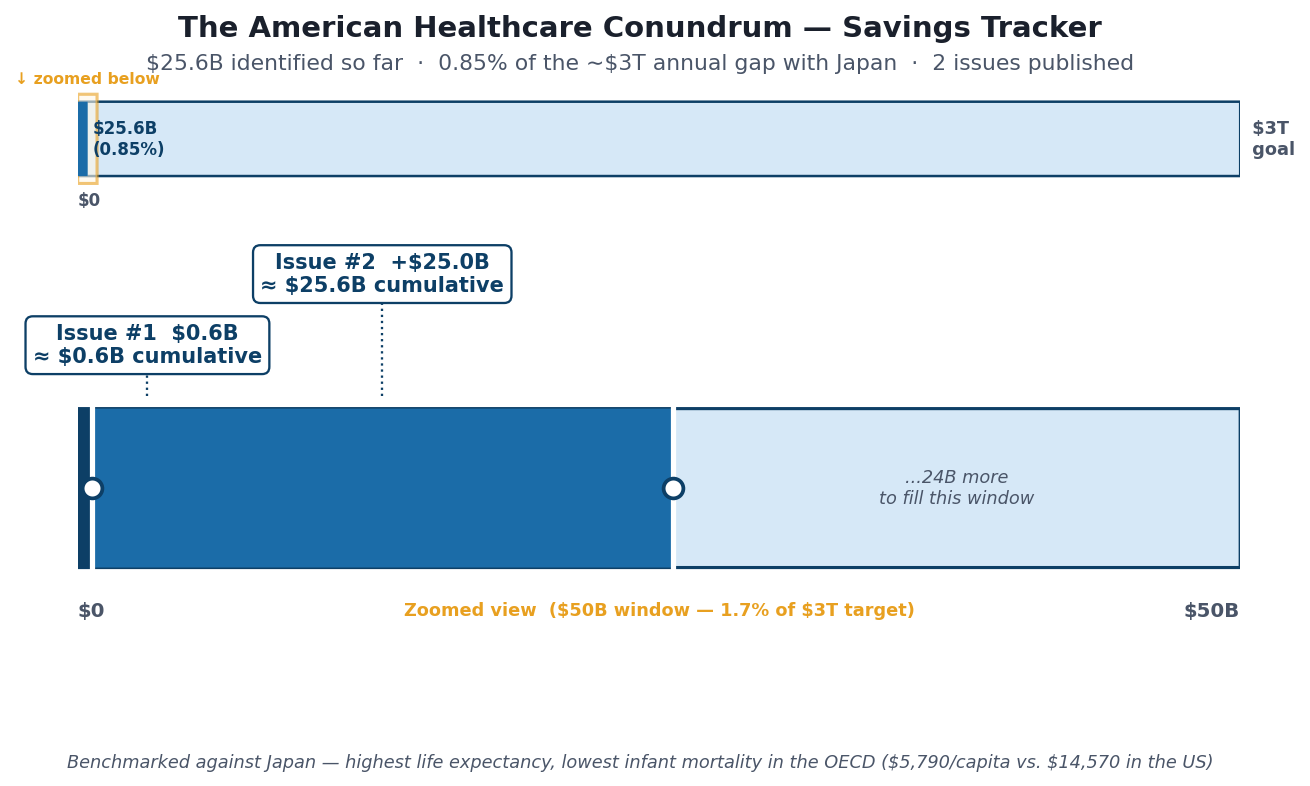
The tracker image above shows two panels: the full $3T scale (where $25.6B is a thin sliver at the far left), and a 1/30 zoom window on the first $100B showing per-issue detail. The sliver is the point — the gap is enormous, and we are just beginning to map it.
Issue #1 ($0.6B): OTC step therapy reform. Issue #2 (+$25.0B): International reference pricing for brand drugs. All estimates are conservative, net-of-rebate figures. Full methodology and code for every issue: github.com/rexrodeo/american-healthcare-conundrum.
The ~$3 trillion target represents the annual gap between US per-capita healthcare spending ($14,570) and Japan's per-capita spending ($5,790), multiplied by the US population of 335 million. Japan has the highest life expectancy in the developed world (84 years) and the lowest infant mortality rate in the OECD (1.7 per 1,000). Sources: OECD Health at a Glance 2025; CMS National Health Expenditure Data 2023; Peterson-KFF Health System Tracker; Commonwealth Fund Mirror Mirror 2024.
The American Healthcare Conundrum publishes when the data is ready. All analysis uses publicly available data. Code is open-source. Figures are validated before publication.
Sources: CMS Medicare Part D Spending by Drug dataset, 2023 (data.cms.gov); NHS Drug Tariff Part VIIIA, March 2026 (nhsbsa.nhs.uk); RAND Corporation, “International Prescription Drug Price Comparisons: Estimates Using 2022 Data,” RRA788-3, February 2024; Peterson-KFF Health System Tracker, “How Medicare negotiated drug prices compare to other countries,” December 2024; CMS, IRA Drug Price Negotiation Program fact sheet, August 2024; MedPAC, June 2023 Report to the Congress, Chapter 2: “Assessing Postsale Rebates for Prescription Drugs in Medicare Part D” (medpac.gov); MedPAC, March 2025 Report to the Congress, Chapter 12: Part D Status Report (medpac.gov); Feldman et al., “Estimating Rebates and Other Discounts Received by Medicare Part D,” JAMA Health Forum, 2021; OECD Health at a Glance 2025; Commonwealth Fund Mirror, Mirror 2024.