
Issue #4 - The Middlemen
How Pharmacy Benefit Managers extract $30 billion a year from the drug supply chain — and what to do about it.

The American Healthcare Conundrum is an investigative data journalism project. Each issue identifies one fixable problem in the US healthcare system, quantifies the waste, and recommends a specific solution. We publish the code. We publish the methodology. We publish the caveats. Anyone can check our work.
SAVINGS TRACKER
Target: ~$3T US-Japan per-capita gap
Japan: highest life expectancy, lowest
infant mortality in OECD, ~half US cost

Full scale: $0 ─────────────────────── $3T
            ████░░░░░░░░░░░░░░░░░░░  4.3%
            ↑ $128.6B identified

Zoomed (first $200B):
 #1  ░    $0.6B   OTC Drug Overspending
 #2  ███  +$25.0B  Drug Pricing
 #3  █████████  +$73.0B  Hospitals
 #4  ████  +$30.0B  PBM Reform
     ─────────────────────────────────────
     Total: $128.6B · $2,871B remaining
The Invisible Layer
In Chillicothe, Ohio, an independent pharmacist named Randy fills prescriptions for about 800 patients. He has been in business for 21 years. He knows which of his patients are diabetic, which ones are struggling to pay their copays, and which ones won't drive the 45 miles to Columbus to fill a specialty prescription.
In 2017, his state's Medicaid auditor ran a routine analysis. The auditor found that the companies managing drug benefits for Ohio's Medicaid program (companies called pharmacy benefit managers) had billed the state $224.8 million more than they had paid pharmacists like Randy to fill those prescriptions. In a single year. From a single state.
That gap between what the benefit manager billed the state and what it paid the pharmacy is called "spread pricing." It is legal. It is nearly universal in Medicaid managed care. And until Ohio's auditor ran the numbers, it was invisible.
Randy's state terminated the spread pricing contracts after the audit. But Randy's state is one of at least fifteen. The other thirty-five are still paying.
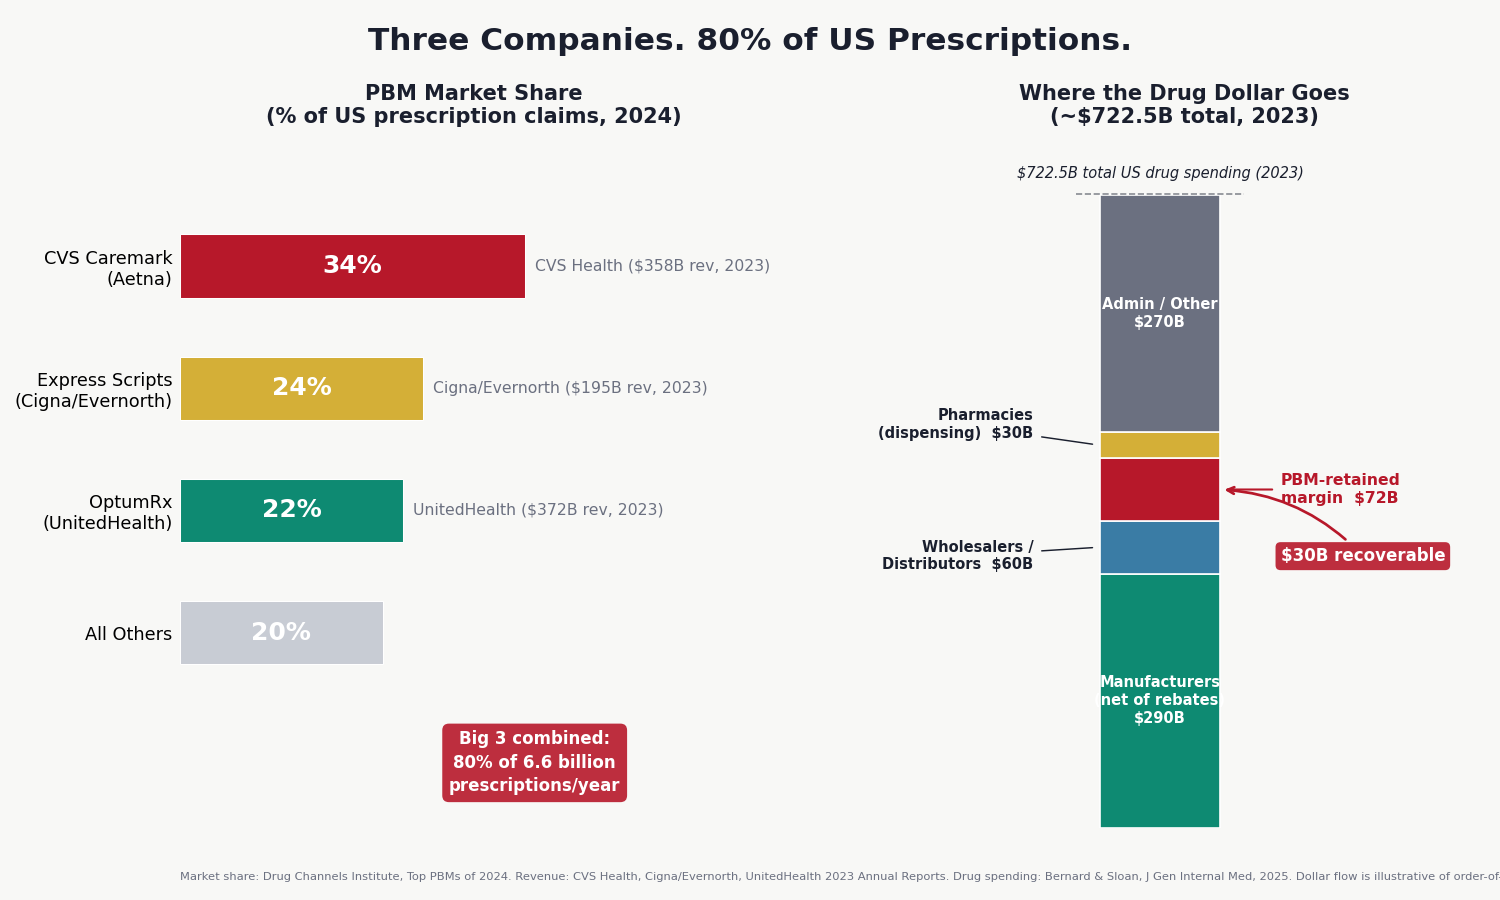
This is Issue #4 of The Healthcare Conundrum. The subject is pharmacy benefit managers, the companies that stand between your doctor's prescription and the pill in your hand. Three of them process 80% of the 6.6 billion prescriptions Americans fill each year. The Federal Trade Commission spent more than two years collecting data from the Big 3 PBMs, issued interim reports in July 2024 and January 2025, and documented billions in extraction it considered serious enough to trigger a lawsuit. The story is not about a drug being too expensive. It is about the layer of infrastructure between the manufacturer and the patient, and how much it costs.
What a PBM Does (And What It Takes)
A pharmacy benefit manager is, at its simplest, a claims processor. When you hand your insurance card to the pharmacist, the pharmacy's computer queries a PBM, which checks your coverage, calculates your copay, and authorizes the transaction. The PBM pays the pharmacy. Your insurer pays the PBM. That processing function genuinely reduces administrative friction. In the 1970s, when PBMs were founded as independent companies, it was a straightforward value proposition.
In 2026, it is something else.
Today's PBMs perform five functions: they design the formulary (the list of which drugs your plan covers and at what cost-sharing tier), they manage utilization (setting prior authorization rules), they negotiate prices with manufacturers, they build pharmacy networks (deciding which pharmacies can participate in your network), and they operate their own mail-order and specialty pharmacies. That last function is the structural problem. The entity that decides which pharmacies can participate in your network, and how much each pharmacy gets paid, now owns the pharmacies collecting those payments.
The academic benchmark for this issue is Mattingly, Hyman, and Bai's 2023 review in JAMA Health Forum, the most comprehensive examination of PBM economics in the published literature. Their framing: PBMs have "horizontal and vertical integration and market concentration" that creates "agency problems," meaning PBMs simultaneously serve plan sponsors, manufacturers, and their own pharmacy subsidiaries. These interests frequently conflict. The PBM is the only party in the room that can resolve the conflict, and it tends to resolve it in its own favor.
The Market
Three companies.
CVS Caremark processes approximately 34% of US prescription claims. Express Scripts (now the PBM arm of Cigna's Evernorth health services subsidiary) processes about 24%. OptumRx, part of UnitedHealth Group's Optum division, handles roughly 22%.
Together: 80% of the 6.6 billion prescriptions Americans fill annually. Drug Channels Institute's 2024 market share analysis shows that the remaining 20% is split among a second tier of smaller PBMs (Humana Pharmacy Solutions, Prime Therapeutics, MedImpact) plus a modest and growing segment of independent, "pass-through" PBMs operating under full transparency.
Each of the Big 3 is not just a PBM. CVS Health is a PBM (Caremark) plus a retail pharmacy chain (CVS Pharmacy) plus an insurance company (Aetna) plus specialty pharmacies. Cigna/Evernorth is a PBM (Express Scripts) plus a specialty pharmacy (Accredo) plus a health services company. UnitedHealth Group is a PBM (OptumRx) plus a mail-order pharmacy (OptumRx Mail Service) plus the largest health insurer in the country (UHC). CVS Health reported revenue of $358 billion in 2023. UnitedHealth Group reported $372 billion. These are not intermediaries in the traditional sense. They are vertically integrated conglomerates in which the intermediary function is one division among many.
Six Ways to Extract $30 Billion
The FTC's six-month investigation of PBM practices, documented in interim reports released in July 2024 and January 2025, identified multiple distinct mechanisms by which PBMs extract value from the drug supply chain. The academic literature and state audits fill in the scale.
Here are the six mechanisms.
1. Spread Pricing
Spread pricing is the simplest mechanism. The PBM bills the health plan $15 for a drug and pays the pharmacy $10. The $5 difference (the "spread") is revenue to the PBM. No disclosure is required. The health plan doesn't know the spread exists unless it audits the contract, and many PBM contracts limit audit rights.
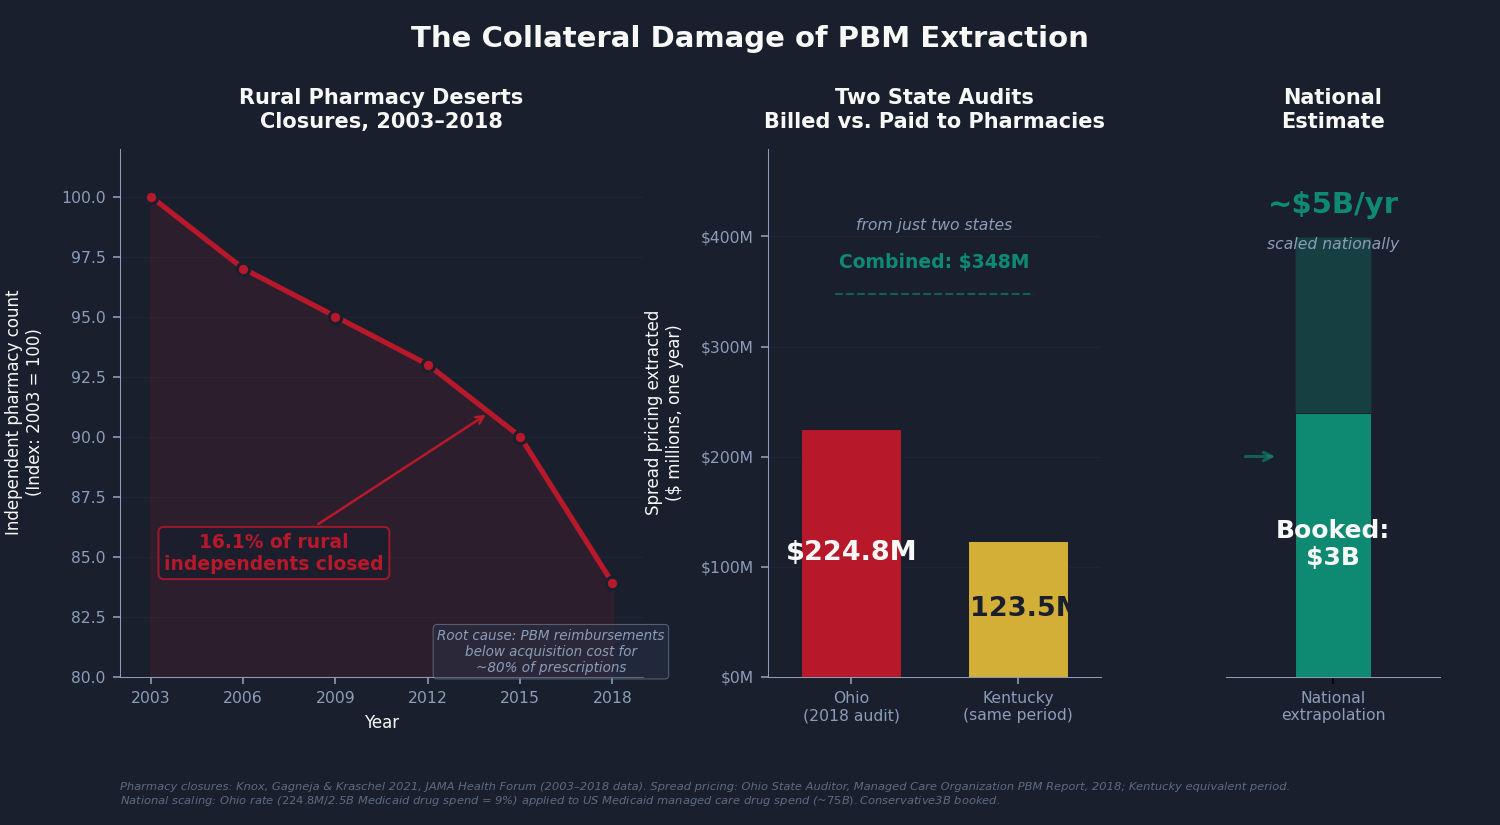
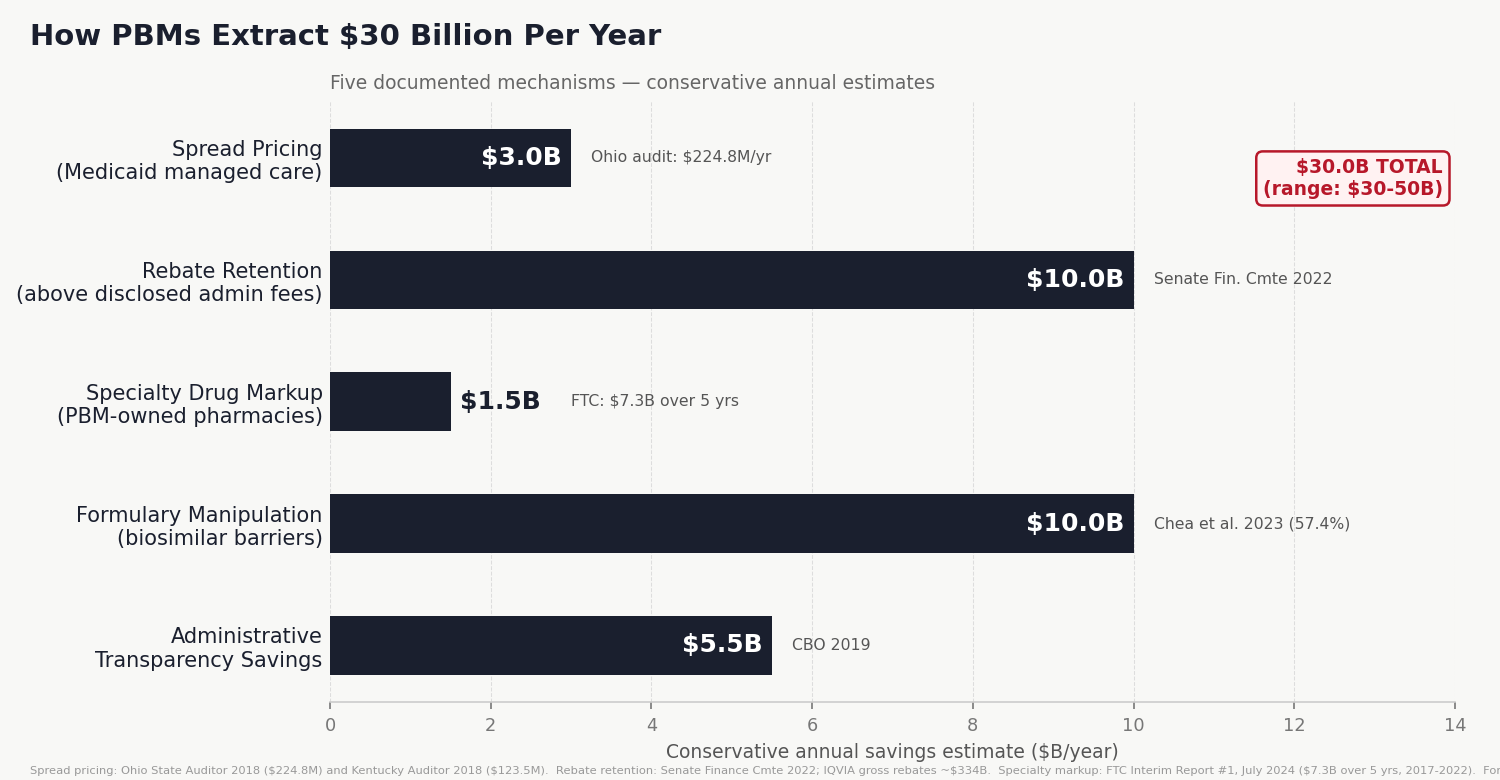
Ohio's 2018 audit found $224.8 million in spread on approximately $3.3 billion in Medicaid drug spending, a spread of about 6.8% of total drug cost. A companion audit of Kentucky found $123.5 million on similar spending in the same period. Those two states combined: $348 million extracted annually from Medicaid programs for low-income people, passed to PBMs, disclosed to no one.
Ohio terminated its spread pricing contracts after the audit. Kentucky restructured its Medicaid PBM contracts. Fifteen or more states have passed laws banning spread pricing in Medicaid. The other thirty-five have not.
Scaling the Ohio rate to national Medicaid managed care drug spending (approximately $75–85 billion per year, covering the 90% of Medicaid enrollees now in managed care): the implied national extraction is approximately $5 billion per year. The analysis here books $3 billion, discounting for the states that have reformed and the assumption that not all remaining states run Ohio-level spreads.
2. Rebate Opacity
Pharmaceutical manufacturers pay enormous sums to PBMs (IQVIA and CMS data suggest approximately $334 billion annually in gross rebates) and insurers in exchange for favorable formulary placement. In principle, these rebates reduce the net cost of drugs and pass through to health plans, reducing premiums. In practice, the passage is incomplete and opaque.
PBMs are not legally required to disclose how much of the rebate they retain. Senate Finance Committee analysis from 2022 estimated that PBMs retain 6–10% of total rebates above disclosed administrative fees. On $334 billion, 5% is $16.7 billion. Adjusting for the roughly 70% of rebates that flow through PBM-administered plans: $11.7 billion annually. Booked conservatively at $10 billion.
Note what the Congressional Budget Office found when it scored the rebate pass-through rule for Medicare Part D in 2019: mandatory full pass-through would save $29.3 billion over ten years ($2.9 billion per year, for Part D alone). The Inflation Reduction Act of 2022 requires Part D plans to fully pass through rebates at the point of sale, effective 2025. That reform is underway. The $10 billion in this analysis covers the remainder: commercial insurance, Medicaid managed care, and the administrative fee structures that persist even in "100% passthrough" contracts through definitional manipulation.
3. Specialty Drug Markup
Specialty drugs (biologics, cancer therapies, specialty infusion drugs) represent a small fraction of prescriptions but a large and growing fraction of drug spending. PBM-owned specialty pharmacies have captured approximately 65% of specialty drug revenue.
The FTC's Interim Report #1 documented $7.3 billion in specialty drug markups at PBM-owned pharmacies relative to independent pharmacies for the same drugs, over the five years from 2017 to 2022. This is not a rate difference. It is the same drug, dispensed through different channels, reimbursed at systematically different rates, because the PBM setting the reimbursement rate owns the pharmacy receiving the higher one.
Annualized: $1.46 billion per year. Given that specialty drug spending is growing at 15–20% annually and PBM specialty market share has continued to increase, $1.5 billion per year is likely an undercount of the current rate.
4. Formulary Manipulation
A formulary is a tiered list: Tier 1 drugs have low copays; Tier 3 drugs have high copays or require prior authorization; excluded drugs are not covered at all. PBMs design formularies.
Chea, Sydor, and Popovian's 2023 analysis of Express Scripts' national formulary examined every drug ESI excluded from coverage and asked a simple question: is there a legitimate reason this drug isn't covered? A legitimate reason would be either clinical (the drug has safety issues, or a better alternative exists) or economic (a cheaper equivalent is available). For 57.4% of ESI's formulary exclusions, the answer was no. The excluded drug had equivalent or better clinical standing than the drugs that remained covered, and it wasn't more expensive. It was cut anyway.
That figure was 48.4% the prior year. The trend is going in the wrong direction.
The mechanism that explains both numbers is the rebate game described above: a manufacturer whose drug is on the formulary paid a larger rebate to ESI for that position. The excluded drug, often a lower-list-price alternative or a biosimilar, couldn't match the rebate offer. From the patient's perspective, the result is straightforward: they arrive at the pharmacy to fill a prescription their doctor wrote, and they're told their plan doesn't cover it. They can appeal, pay out of pocket, or switch drugs. Most switch drugs. The drug that won the formulary slot is frequently the one that costs more.
The mechanism in brief: manufacturers pay rebates to secure favorable tier placement. A manufacturer willing to pay a larger rebate can buy Tier 1 status for a drug that would otherwise be Tier 3. A biosimilar (a lower-cost alternative to a brand biologic) typically commands a smaller rebate because its list price is lower. So the biosimilar gets Tier 3 or excluded, and the brand stays preferred.
The FDA has approved more than 100 biosimilars. The US biosimilar market penetration rate is dramatically below European levels, where formulary policy does not systematically disadvantage them. Kwon, Sarpatwari, and Dusetzina's 2025 study in JAMA Health Forum found that even with an FDA-approved interchangeable biosimilar (insulin glargine-yfgn / Semglee) available, market share reached only 20.6% in the least-restrictive states, largely because PBM formulary decisions determine whether the biosimilar is affordable at the pharmacy counter.
Conservative annual savings from fixing formulary policy to systematically favor biosimilars and generics: $10 billion. This is the widest range in the model ($5–15 billion) because it depends on the rate of biosimilar adoption. The $10 billion figure applies a conservative 30–40% of the gap between US and comparable-market biosimilar penetration.
5. Self-Preferencing
This is the structural version of specialty markup. PBMs direct patients to their own pharmacies through network design: the PBM's mail-order pharmacy is "preferred," meaning your copay is lower if you use it. Independent pharmacies pay access fees to be included in narrow networks. Specialty drugs often require "mandatory specialty pharmacy" dispensing, at the PBM's own specialty pharmacy.
Motheral and Fairman's 2020 analysis of Florida Medicaid data documented the result: five specialty pharmacies, all owned by managed care organizations or PBMs, collected 28% of prescription drug profit while dispensing only 0.4% of claims. That's a 70-to-one profit-per-claim advantage over independent pharmacies. Not because PBM pharmacies are 70 times more efficient. Because they set their own reimbursement rates.
The self-preferencing savings are embedded within the specialty markup figure above. They are not separately booked to avoid double-counting.
6. Independent Pharmacy Destruction
The last mechanism is not an extraction. It is the consequence of the others. Knox, Gagneja, and Kraschel documented in JAMA Health Forum in 2021 that between 2003 and 2018, 16.1% of independent pharmacies in rural areas closed. Some pharmacies reported that 80% of their reimbursements were below their cost of acquiring and dispensing the drug. When the MAC list (the PBM's maximum allowable cost for generic drugs) fails to update when acquisition costs rise, the pharmacy absorbs the loss. Chains can negotiate better terms. Independent pharmacies take the MAC list or exit the network, which means their patients lose coverage for the pharmacy entirely.
Rural pharmacy deserts do not have a dollar value that fits neatly into a savings model. But when the nearest pharmacy is 45 miles away, patients skip doses. Skipped doses produce hospitalizations. Hospitalizations cost money. The harm is real and it is downstream of the extraction documented above.
New Data: The Biosimilar Non-Adoption Gap
The formulary manipulation mechanism is well-documented in regulatory reports and academic literature. But the molecule-by-molecule contrast in Medicare's own data makes the pattern hard to miss.
The CMS Medicare Part D Drug Spending by Drug file, released May 2025 for data year 2023, lists gross spending and claim counts for every drug brand and formulation paid under Medicare's drug benefit. For any molecule where both a brand originator and FDA-approved biosimilars exist, the data makes the formulary picture explicit.
The results are striking.
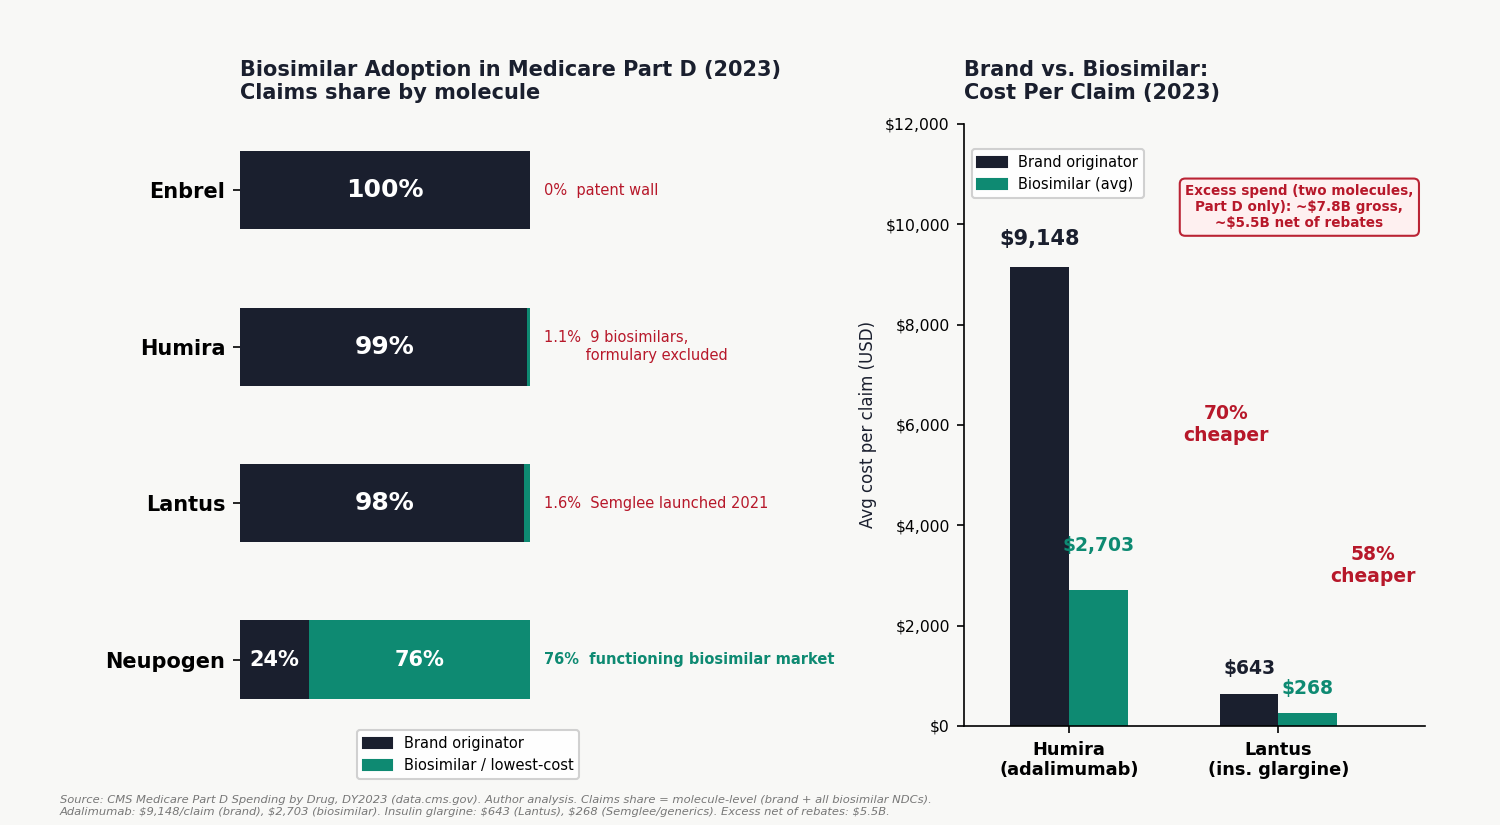
For filgrastim and pegfilgrastim (the colony-stimulating factors used to prevent infection in cancer patients), biosimilars captured 76% of Medicare Part D claims in 2023 (author analysis of CMS Medicare Part D Spending by Drug, DY2023). Eight biosimilars (Zarxio, Nivestym, Granix, Fulphila, Ziextenzo, Udenyca, Nyvepria, Fylnetra) outcompeted the brand originators Neupogen and Neulasta on both volume and price. The brand drugs retained 24% of claims. This is what a functioning biosimilar market looks like.
For adalimumab (the active ingredient in Humira, the world's best-selling drug), the story is entirely different. Nine FDA-approved adalimumab biosimilars launched in January 2023. By the end of 2023, biosimilars held 1.1% of Medicare Part D claims and 0.3% of spending. The brand Humira cost Medicare $9,148 per claim on average. The available biosimilars averaged $2,703 per claim, a 3.4× price difference. Medicare spent $6.06 billion on Humira formulations and $0.02 billion on biosimilars.
For insulin glargine (the Lantus molecule), the pattern is the same. Semglee, FDA-approved as an interchangeable biosimilar in July 2021, averaged $268 per claim versus Lantus's $643. In 2023, Semglee and its generic equivalents held 1.6% of claims.
For etanercept (Enbrel): zero biosimilar penetration. The FDA approved Erelzi (etanercept-szzs) in 2016. In 2023, etanercept biosimilars did not appear in the Part D spending data at all. Enbrel held 100% of the $2.95 billion market.
The contrast between filgrastim and adalimumab is not a clinical story. Both are self-injected biologics. Both have FDA-approved biosimilars with interchangeability designations. The difference is commercial: filgrastim biosimilars launched in 2015 into a market where the rebate competition for formulary position was less intense and the Part B/Part D dynamics gave providers more latitude to substitute. Humira biosimilars launched in 2023 against an AbbVie rebate wall that had been building for years, and PBMs, whose formulary contracts had already committed to preferring Humira in exchange for high rebates, had no financial incentive to switch.
In Europe, adalimumab biosimilars launched in 2018. Within two years, they captured more than 80% of the market in most countries. In five years of US biosimilar availability, Medicare's adalimumab biosimilar share is 1.1%.
The gross excess spending from brand lock-in on just these two molecules (adalimumab and insulin glargine) in Medicare Part D alone: approximately $7.8 billion per year. Net of estimated rebates: approximately $5.5 billion. That is from two molecules, in Medicare alone, in one year.
The Insulin Files
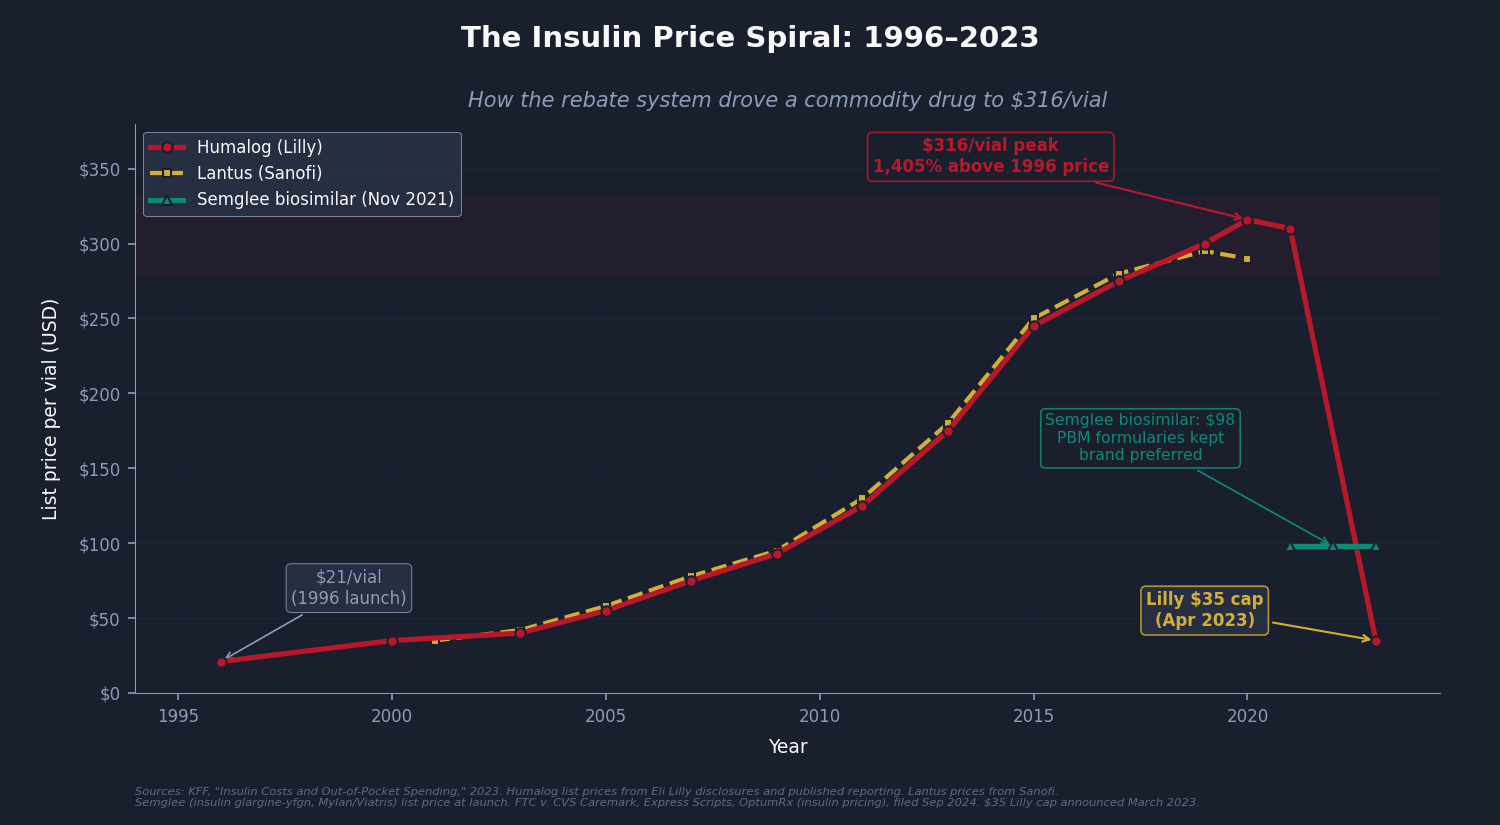
No single drug illustrates the PBM rebate mechanism more cleanly than insulin.
Insulin is not a new molecule. The basic formulas (regular human insulin, NPH insulin) have been off-patent for decades. The version relevant here is analog insulin: Humalog (insulin lispro, Eli Lilly), Lantus (insulin glargine, Sanofi), and NovoLog (insulin aspart, Novo Nordisk). These are patented analog formulations that became the standard of care for type 1 and type 2 diabetes management through the 1990s and 2000s.
In 1996, Humalog launched at approximately $21 per vial. By 2022, Humalog's list price was $316 per vial (KFF, "Insulin Costs and Out-of-Pocket Spending," 2023), an increase of roughly 1,400% over 26 years, for a drug whose manufacturing process is well-established and whose underlying patent position had significantly eroded.
The price did not increase because manufacturing costs rose. It increased because three manufacturers were competing for formulary position, and formulary position required paying large rebates to PBMs, and large rebates require high list prices.
Here is how the mechanism worked: A manufacturer willing to set a list price of $300 per vial and pay a $100-per-vial rebate to the PBM could secure Tier 1 formulary placement (low patient copay). A biosimilar insulin with a $98 list price could offer at most a $10-per-vial rebate. The PBM puts the $300 brand in Tier 1 and the $98 biosimilar in Tier 3 or excludes it entirely.
The patient's copay is calculated on the pre-rebate list price. So the patient pays 20% of $300 ($60) for the brand, versus 40% of $98 ($39.20) for the biosimilar, except the biosimilar is often excluded, so the patient has no choice. The plan pays the remainder. The manufacturer keeps $200 net (after the $100 rebate). The PBM retains a portion of the rebate as administrative fees. The independent pharmacist fills the prescription and pockets a dispensing fee of $2.
The FTC's September 2024 lawsuit against all three Big 3 PBMs specifically names this dynamic. The complaint alleges that PBMs maintained high-list-price brand insulins (Humalog, Lantus, NovoLog) as preferred formulary drugs specifically because those manufacturers paid the largest rebates, while structurally excluding lower-list-price biosimilar insulins (Semglee at $98/vial, Rezvoglar at $92/vial) that would have cost plans and patients substantially less.
The Inflation Reduction Act's $35 monthly cap on insulin for Medicare beneficiaries (effective 2023) helped patients. Eli Lilly, Novo Nordisk, and Sanofi subsequently extended $35 caps voluntarily to commercial plans. These are meaningful improvements. But the $35 cap is a band-aid over the wound, not a repair of the mechanism that made the wound. The cap exists because list prices were $300. The question this issue asks is why list prices were $300 in the first place, and the answer involves formulary placement and the rebate system, not manufacturing economics.
One real-world test of this thesis exists. Mark Cuban's Cost Plus Drugs, launched in 2022, bypasses PBMs entirely: drug acquisition cost plus 15% margin plus a $3 dispensing fee, no rebate contracts, no formulary placement to buy. For generics, it works: drugs that retail pharmacies charge $50–200 are available for $4–20. The model's limit is equally instructive: it cannot scale to specialty biologics, where a $25,000 list price and a 60% rebate generates $15,000 per prescription in gross rebate dollars. That revenue flow is what buys formulary position. Net pricing collapses the system, which is exactly why the system resists it.
What the FTC Found
The Federal Trade Commission's two interim reports, released in July 2024 and January 2025, are the most detailed official examination of PBM practices ever published. The Commission collected data under 6(b) investigative orders issued in 2022, spanning billing records, formulary contracts, and rebate agreements from the Big 3 plus three smaller PBMs. What it found:
PBM-owned specialty pharmacies were reimbursed at substantially higher rates than independent pharmacies for identical specialty drugs. The differential was not marginal. The FTC documented $7.3 billion in excess payments to PBM-owned pharmacies over five years.
Patient steering through network design was systematic. PBMs restricted specialty drug dispensing to affiliated pharmacies, often framing it as a clinical safety or quality requirement. The FTC found limited clinical evidence that the restrictions improved outcomes; the financial benefit to PBM pharmacy subsidiaries was clear.
Rebate contracts were structured specifically to reward high list prices. Manufacturers with the highest list prices (and thus the largest rebate dollars) consistently received preferred formulary placement. Lower-list-price alternatives, including biosimilars, were systemically disadvantaged.
The Commission's conclusion was serious enough to file suit in September 2024 against CVS Caremark, Express Scripts, and OptumRx over insulin pricing specifically: the first time the FTC had sued all three Big 3 PBMs simultaneously.
On February 4, 2026, the FTC secured its first settlement: Express Scripts agreed to terms that directly restructure PBM economics, going beyond transparency to operational reform. The Commission projects $7 billion in patient savings on out-of-pocket costs over the next decade ($700 million per year from a single PBM). That figure is directionally consistent with this issue's $30 billion industry-wide estimate: if one PBM's settlement produces $700 million in annual savings, the extraction across all three Big 3 PBMs and the broader market is substantially larger. The FTC remains in active litigation against CVS Caremark and OptumRx.
For context on the FTC's enforcement posture: the agency's filing describes PBMs as having created "a system that rewards pharmaceutical manufacturers for raising list prices" rather than lowering them. That is not a characterization of an industry with minor transparency problems. It is a description of a system structured to produce the opposite of its stated purpose.
The Fix
The day before that settlement, on February 3, 2026, Congress enacted sweeping PBM reform as part of the Consolidated Appropriations Act. The law requires 100% rebate pass-through to plan clients, delinks PBM compensation in Medicare Part D from list prices and rebates, expands the legal definition of "PBM" to cover rebate aggregators and utilization management entities, mandates semiannual reporting on net drug spending and spread pricing, and imposes penalties up to $10,000 per day for non-disclosure ($100,000 for false information).
The fix is law. But the 100% rebate pass-through for commercial plans does not take effect until plan years beginning January 1, 2029, three years from now. The Part D delinking is effective sooner, but enforcement mechanisms are untested. And three of the six extraction mechanisms documented in this issue remain structurally unaddressed by the new law.
Here is what the law does, what it does not do, and what remains:
Rebate pass-through mandate (now enacted, phased in by 2029). PBMs must remit all rebates, fees, and manufacturer remuneration to plan clients quarterly. The IRA did this for Part D in 2025. The CAA 2026 extends it to commercial insurance under ERISA. CBO's Part D estimate: $2.9 billion per year; the full-market equivalent is substantially larger. The three-year phase-in for commercial plans means the full savings will not materialize until 2030 at the earliest.
Fiduciary standard. Require PBMs to act as fiduciaries to the plan sponsors they serve, meaning PBMs must optimize formulary design and pharmacy networks for plan cost, not PBM revenue. This is not a novel legal concept. Investment advisors have operated under fiduciary duty for decades. The argument that PBMs, administering hundreds of billions of dollars on behalf of employers, unions, and government programs, should have no duty to those clients is the argument that makes the current extraction possible.
Spread pricing prohibition (all payers). Fifteen-plus states have banned spread pricing in Medicaid after state audits documented the Ohio-level extractions. Federal law should extend the prohibition to all PBM-administered programs, including commercial and Part D. Ohio showed it can be done: the state terminated spread pricing contracts, moved to pass-through models, and replaced the lost PBM margin with transparent administrative fees. Drug spending dropped. Pharmacies survived.
Formulary transparency and biosimilar preference. Require PBMs to disclose formulary placement criteria and mandate that FDA-approved biosimilars be included at Tier 1 (preferred) unless there is documented clinical reason for exclusion. The FDA has done its job, approving 100+ biosimilars. The formulary is the barrier.
Vertical divestiture (or open networks). The structural conflict of interest (PBMs designing networks that direct patients to PBM-owned pharmacies) does not have a transparency solution. It has a structural solution: the entities that administer drug benefits should not own the pharmacies filling those prescriptions. Short of divestiture, requiring open networks (any licensed pharmacy that meets clinical standards may participate at the same reimbursement rate) would partially address the conflict.
Multiple states have advanced complementary legislation. Arkansas enacted the first state ban on PBM ownership of pharmacies (Act 624, April 2025), though a federal court issued a preliminary injunction blocking enforcement in July 2025 and the state has appealed. California and Colorado adopted PBM delinking compensation models, and Utah implemented drug rebate pass-through requirements. The Department of Labor has proposed a rule (comment deadline: April 15, 2026) requiring PBM fee disclosure for self-insured employer plans under ERISA, the exact spread pricing mechanism documented by Ohio's audit.
The federal and state reforms are meaningful. The rebate pass-through mandate addresses Mechanism #2. The transparency reporting creates audit trails for Mechanism #1 (spread pricing). The delinking provision begins to erode the formulary manipulation incentive (Mechanism #4).
But three of the six mechanisms remain structurally unaddressed. The specialty drug markup ($1.5B, Mechanism #3) persists as long as PBM-owned pharmacies set their own reimbursement rates. Self-preferencing (Mechanism #5) continues in every PBM that owns pharmacies. And the independent pharmacy destruction (Mechanism #6) driven by below-cost reimbursement has no federal remedy in the new law. The FTC's September 2024 lawsuit against all three Big 3 PBMs over insulin pricing remains active, and in February 2026 the Commission secured a landmark settlement with Express Scripts. The trajectory is toward reform, but the $30 billion extraction is not fully addressed.
What the 2026 law does and does not fix:
The $10 billion booked for rebate opacity will shrink as the pass-through mandate takes effect, though the 2029 commercial plan effective date and definitional loopholes ("bona fide service fees") mean the full savings will not materialize for years. The $3 billion in spread pricing will decline as transparency reporting makes hidden spreads auditable. The remaining mechanisms ($1.5B specialty markup, $10B formulary manipulation, $5.5B admin) are partially addressed by transparency but not structurally resolved. This issue's $30 billion estimate should be read as the current annual extraction; the enacted reforms, once fully implemented, may reduce it by $8-12 billion, leaving $18-22 billion in ongoing structural extraction that requires the deeper reforms outlined above.
The PBM industry's lobbying budget in Washington is substantial. The three Big 3 PBM parent companies documented in this issue's "Who Profits" section reported a combined $133 million in federal lobbying between 2020 and 2024 (OpenSecrets). PCMA, the PBM trade association, spent an additional $40–50 million over the same period. The 2026 law is evidence that the lobbying wall can be breached, but the remaining structural conflicts require continued pressure.
Who Profits
Who Profits: CVS Health (CVS), CVS Caremark
FY2024 Revenue: $372.8B | Operating Margin: 2.3% | CEO Comp (David Joyner): $17.8M
Stock Buybacks (2020–24): ~$8.5B | Lobbying (2020–24): ~$46M
This issue's mechanism: CVS Caremark processes 34% of US prescriptions. As documented above, Caremark's spread pricing, rebate retention, and specialty pharmacy self-preferencing extract billions annually from the drug supply chain. Ohio's Medicaid audit found $224.8M/year in spread from a single state. The entity that designs formularies (deciding which drugs patients can access and at what cost) also owns the pharmacies filling those prescriptions.Who Profits: UnitedHealth Group (UNH), OptumRx
FY2024 Revenue: $400.3B | Operating Margin: 8.1% | CEO Comp (Andrew Witty): $26.3M
Stock Buybacks (2020–24): ~$33B | Lobbying (2020–24): ~$43M
This issue's mechanism: OptumRx handles 22% of US prescriptions as part of the largest health conglomerate in the country, which is simultaneously the largest health insurer (UnitedHealthcare), a PBM, a mail-order pharmacy, and a healthcare services company. The vertical integration means UNH profits from the drug at every link in the chain: insuring the patient, managing the benefit, filling the prescription, and keeping the rebate.Who Profits: The Cigna Group (CI), Express Scripts/Evernorth
FY2024 Revenue: $247.1B | Operating Margin: 3.8% | CEO Comp (David Cordani): $23.3M
Stock Buybacks (2020–24): ~$29B | Lobbying (2020–24): ~$44M
This issue's mechanism: Express Scripts processes 24% of US prescriptions through Cigna's Evernorth division. The FTC's 2024 lawsuit names Express Scripts alongside the other Big 3 PBMs for maintaining high-list-price brand insulins as preferred formulary drugs specifically because manufacturers paid the largest rebates, while excluding lower-cost biosimilars that would save plans and patients money.
Sources: CVS Health 10-K, UnitedHealth Group 10-K, The Cigna Group 10-K, and DEF 14A proxy statements (SEC EDGAR); FTC v. CVS Caremark et al. (September 2024); company earnings releases; OpenSecrets.org federal lobbying disclosure database (2020–2024); company cash flow statements.
Savings Tracker: $128.6 Billion and Counting
Four issues. Four distinct mechanisms in the US healthcare system. Four layers of excess spending that do not exist in comparable countries.
Issue #1: OTC Drug Overspending: $0.6B/year
Issue #2: Drug Reference Pricing (brand-name drugs vs. international peers): $25.0B/year
Issue #3: Hospital Commercial Reference Pricing: $73.0B/year
Issue #4: PBM Reform (spread pricing, rebate retention, specialty markup, formulary manipulation, admin transparency): $30.0B/year
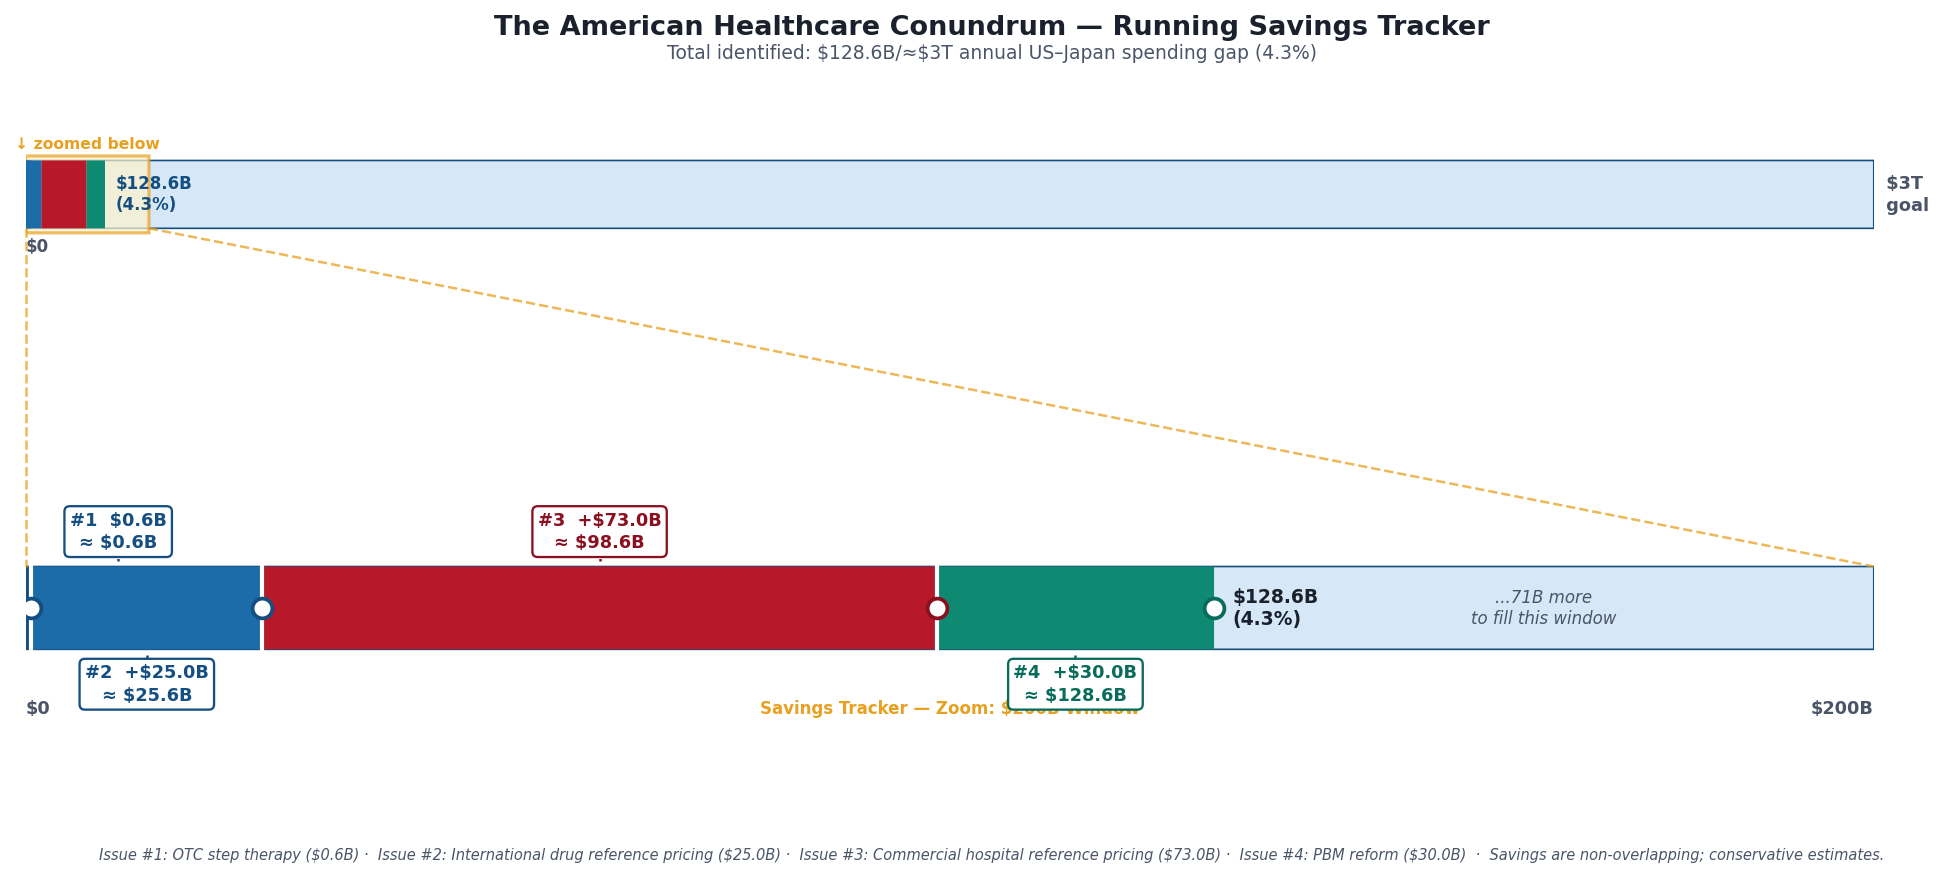
Running total: $128.6 billion per year, 4.3% of the $3 trillion annual gap between US and Japanese per-capita healthcare spending.
The methodology here is conservative by design. The $30 billion books the low end of a range that many independent analyses place at $40–50 billion. Each of the five mechanisms is documented by a distinct source: the Ohio state auditor (spread pricing), the FTC (specialty markup), the Senate Finance Committee (rebate retention), peer-reviewed analysis in JAMA Health Forum (formulary manipulation), and the CBO (administrative transparency). None of these mechanisms overlaps with the savings identified in Issues #1 through #3; they address a different layer of the supply chain.
What's Next
A note on Issue #3: since publication, two states (Indiana and Vermont) enacted hospital reference pricing legislation in 2025, with Vermont becoming the first state to establish Medicare-based price caps for all hospitals and payers. More than a dozen additional states, including Washington, are advancing similar bills. The original HCRIS analysis of 3,193 hospitals has entered state legislative discussions. The data is informing policy.
Issue #4 mapped the drug supply chain's middle layer: the companies that stand between manufacturer and patient and capture value from both.
Issue #5 maps the paper between the doctor and the dollar.
The United States spends approximately $800 billion per year administering its healthcare system: billing, prior authorizations, documentation, claims processing, appeals, credentialing, utilization review, and the small army of people on both sides of the transaction who spend their days navigating the rules rather than providing care. That figure is not a rough estimate. It is the finding of peer-reviewed research published in JAMA and Annals of Internal Medicine. Other developed countries spend 12–15% of healthcare expenditure on administration. The US spends 34%.
No other country in the OECD has built a healthcare system this complex. No other country requires this much infrastructure to get a doctor paid for treating a patient. The question is not whether the complexity is expensive (it demonstrably is). The question is whether any of it improves outcomes for patients.
The answer the data gives is: not at the scale we're paying for it.
Issue #5 is "The Paper Chase." It follows the $800 billion and asks what, if anything, we get for it.
If you want to follow the code: github.com/rexrodeo/american-healthcare-conundrum
If you want to push back on the methodology: reply to this email, or leave a comment below.
If you know someone who works in pharmacy, PBM, drug pricing, or healthcare policy who should read this: forward it.
Savings Tracker: Running Total After Issue #4, $128.6 billion / ~$3 trillion (4.3%)
The tracker image above shows two panels: the full $3T scale (where $128.6B remains a thin sliver at the far left), and a $200B zoom window showing per-issue contributions.
Issue #1 ($0.6B): OTC-equivalent step therapy for Medicare Part D: requiring patients to try OTC alternatives before prescription coverage activates. Issue #2 (+$25.0B): International reference pricing for Medicare brand drug negotiations, benchmarking against the average paid by Germany, France, Japan, UK, and Australia, applied to high-spend brand drugs; $25B figure applies a ~49% net adjustment to gross savings of $48.9B. Issue #3 (+$73.0B): Commercial hospital reference pricing: capping commercial insurer payments at 200% of Medicare for inpatient services. Issue #4 (+$30.0B): PBM reform. Five mechanisms: spread pricing elimination in Medicaid managed care ($3B), rebate pass-through mandate for commercial and Medicaid ($10B), specialty drug markup cap ($1.5B), formulary reform requiring biosimilar preference ($10B), and administrative transparency savings ($5.5B). Sources: Ohio State Auditor 2018; FTC Interim Reports I and II (2024, 2025); CBO 2019; IQVIA 2022; Drug Channels Institute 2024; Mattingly et al. JAMA Health Forum 2023.
The ~$3 trillion target represents the annual gap between US per-capita healthcare spending ($14,570) and Japan's per-capita spending ($5,790), multiplied by the US population of 335 million. Japan has the highest life expectancy in the developed world (84 years) and the lowest infant mortality rate in the OECD (1.7 per 1,000). Sources: OECD Health at a Glance 2025; CMS National Health Expenditure Data 2023; Peterson-KFF Health System Tracker; Commonwealth Fund Mirror Mirror 2024.
The American Healthcare Conundrum publishes when the data is ready. All analysis uses publicly available data. Code is open-source. Figures are validated before publication.
Amazing insight. Thanks for sharing!