
Issue #11: The MA Overpayment
How Medicare Advantage gets paid more for the same patient

Each issue of The American Healthcare Conundrum identifies one fixable problem in U.S. healthcare spending, builds the data case, and recommends a specific policy fix. All analysis uses publicly available data. Code is open-source.
Target: ~$3.24T US-Japan per-capita spending gap
(Japan: highest life expectancy, lowest infant
 mortality in OECD, ~half US per-capita spend)

Full scale: $0 ───────────────────────── $3.24T
            ████░░░░░░░░░░░░░░░░░░░░░░  14.5%
            ↑ $470.8B identified

Per-issue savings (1 block ≈ $8B; max bar = $200B):
 #1 ▏                          $0.6B   OTC Drug Overspending
 #2 ███                       $25.0B   Drug Pricing
 #3 █████████                 $73.0B   Hospital Pricing
 #4 ████                      $30.0B   PBM Reform
 #5 █████████████████████████ $200.0B  Admin Waste
 #6 ███                       $28.0B   Supply Waste
 #7 █████                     $40.0B   GLP-1 Pricing
 #8 ████                      $32.0B   Denial Machine
 #9 █                          $6.6B   Employer Trap
#10 █                          $7.6B   Procedure Mill
#11 ████                      $28.0B   MA Overpayment (this issue)
   ───────────────────────────────────────────────
   Total: $470.8B  ·  $2,769.2B remaining
   Scale: $3.24T (CMS NHE 2024; Japan OECD 2023)
The MA Overpayment
A nurse comes to your house. She has 45 minutes. She is paid by your Medicare Advantage plan, and her job is not to treat you. Her job is to code you. She asks the questions that produce diagnoses that produce risk-adjustment payments that produce next year's revenue for the plan.
You don't get a treatment. The plan gets a payment.
The nurse is not a villain. She is a clinician doing the job the payment system designed for her. The Office of Inspector General (OIG) found in October 2024 that in-home health risk assessments (HRAs) accounted for 46 percent of all HRA-only diagnosis payments in 2023, while making up only 13 percent of HRA visits. The yield-per-visit from an in-home assessment is roughly 5.7 times higher than from other assessment modalities. That ratio tells you what the visits are optimized for.
The mechanism is not billing fraud, though some of it has crossed into that territory. The mechanism is a payment formula. Medicare Advantage (MA) plans receive a fixed monthly capitation payment per enrollee, adjusted upward for each documented diagnosis. The plans do not deliver the diagnoses; they recruit them, through in-home assessments and retrospective chart reviews whose primary purpose is documentation, not treatment. The mechanism is risk-score growth in MA that exceeds risk-score growth in the matched fee-for-service (FFS) population, after the Centers for Medicare and Medicaid Services (CMS) applies its statutory recapture. The residual is the overpayment.
A reasonable objection at this point: isn't MA supposed to cost more? Yes, it does cost more, by design. It covers more services, charges lower out-of-pocket, and enrolls a slightly different population. That is not what this issue is about.
What we are measuring is narrower. CMS pays MA plans on a formula that is supposed to calibrate the monthly payment to what the same enrollee would have cost in traditional Medicare, adjusted up for sicker patients and down for healthier ones. The adjustment runs on documented diagnoses. The home-visit nurse, the chart review industry, and the provider documentation incentives all exist on the MA side and not on the FFS side. The same enrollee ends up looking sicker on paper in MA than in FFS, and CMS pays based on the paper. That gap is the overpayment.
CMS knows this. The two risk-adjustment formulas the rest of this issue compares are its two attempts at solving the problem.
Two Numbers and What This Issue Does With Them
Every March, the Medicare Payment Advisory Commission tells Congress how much Medicare Advantage costs more than traditional Medicare. In March 2026, the answer was $76 billion. That is the all-in MA-FFS payment gap for 2026, across all sources: coding intensity, favorable selection, and benchmark structure.
This issue books $22 billion of that $76 billion. The $22 billion is coding intensity: MA risk scores climb faster than FFS risk scores, and CMS's 5.91 percent annual recapture doesn't claw back the full difference. The other $54 billion comes from favorable selection and benchmark structure. Those dollars are real. We name them here and save the analysis for future issues.
The $22 billion for 2026 is MedPAC's number. We are not claiming it as ours. What we add is the range around it: CMS is in the middle of switching its risk-adjustment formula, and the overpayment looks different under the old formula than under the new one. We show both. The gap between them is what this issue is about.
The Model Transition Is the Story
What V24 and V28 Are
CMS uses a Hierarchical Condition Category (HCC) model to convert a patient's diagnoses into a risk score that drives the monthly capitation payment. From 2020 through 2023, the active model was HCC version 24 (V24). Beginning in 2024, CMS began phasing in version 28 (V28), designed specifically to reduce the coding-intensity advantage that MA plans had accumulated under V24.
The transition is blended: 2024 was 67 percent V24 and 33 percent V28; 2025 was 33 percent V24 and 67 percent V28; 2026 is 100 percent V28. MedPAC publishes the blended payment-year figure. It does not publish the pure-model counterfactuals side by side.
We report both implied values.
The Band
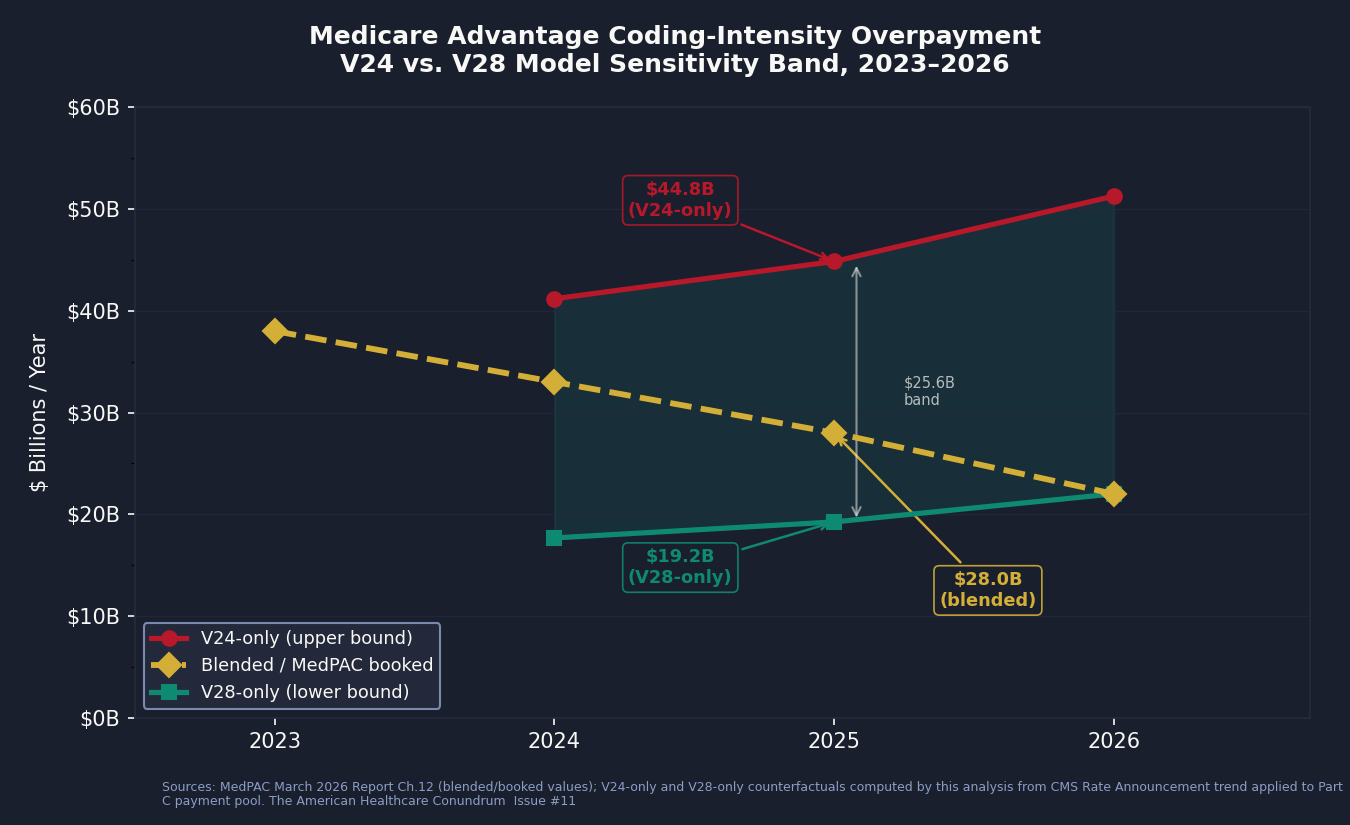
Applying MedPAC's published V24-era coding share to the 2025 Part C payment pool, and doing the same with the V28-era share, yields two boundary values for 2025, the transition year most useful for understanding the policy impact:
Applying MedPAC's V24-era coding share to the 2025 payment pool: $44.8 billion
Applying MedPAC's V28-era coding share to the 2025 payment pool: $19.2 billion
The blended payment-year value MedPAC publishes: $28.0 billion
The band width is $25.6 billion. The entire policy debate about whether V28 "fixed" the coding-intensity problem lives inside that band. MedPAC reports one number from the middle of it.
The V24-era ceiling depends on which years anchor the comparison: using the mature post-pandemic window (2022-2023) gives $44.8B; widening to include the full V24 era (2020-2023) gives $39.4B; using 2021-2023 (pandemic-corrected) gives $36.6B. We report the published ceiling and document the alternatives in cross_validation.csv.
For 2024, the band runs from $17.7 billion (V28-only) to $41.2 billion (V24-only), with the blended value at $33 billion. For 2026, the V28-only and blended values converge, as V28 is now fully in effect, and MedPAC's figure is $22 billion.
We book $28 billion for 2025 as the central estimate, consistent with MedPAC's most recent projection. We are explicit that this is the curated anchor, not an independent measurement. The V24/V28 sensitivity band is what we calculate by applying each model's share to the 2025 pool.
What the Band Tells You
The coding-intensity overpayment peaked at $38 billion in 2023, under V24-only conditions. It represented 8.5 percent of the $448 billion Part C payment pool that year. By 2026, MedPAC projects it falls to $22 billion, or 3.6 percent of the $615 billion pool.
That trajectory is encouraging. V28 appears to be working on the dimension it was designed for. But $22 billion annually, after two years of phase-in by a model specifically designed to close this gap, is not a solved problem. It is a structural residual. The statutory coding-intensity adjustment has been frozen at its 5.91 percent floor since 2018. MedPAC has recommended raising it every year since at least 2014. Congress has not acted.
The HRA Mechanism: How Diagnoses Are Recruited
The 2017 Finding
In September 2020, the Department of Health and Human Services (HHS) Office of Inspector General published an analysis of 2017 Medicare Advantage data that measured, for the first time, how much money flowed to MA plans based solely on diagnoses documented during health risk assessments: diagnoses that appeared nowhere else in the patient's medical record.
The 2017 number: $2.6 billion. Of that, $2.1 billion (81 percent) came from in-home health risk assessments. One unnamed MA organization generated 58 percent of all HRA-only payments while enrolling 22 percent of MA beneficiaries. The report number is OIG OEI-03-17-00474.
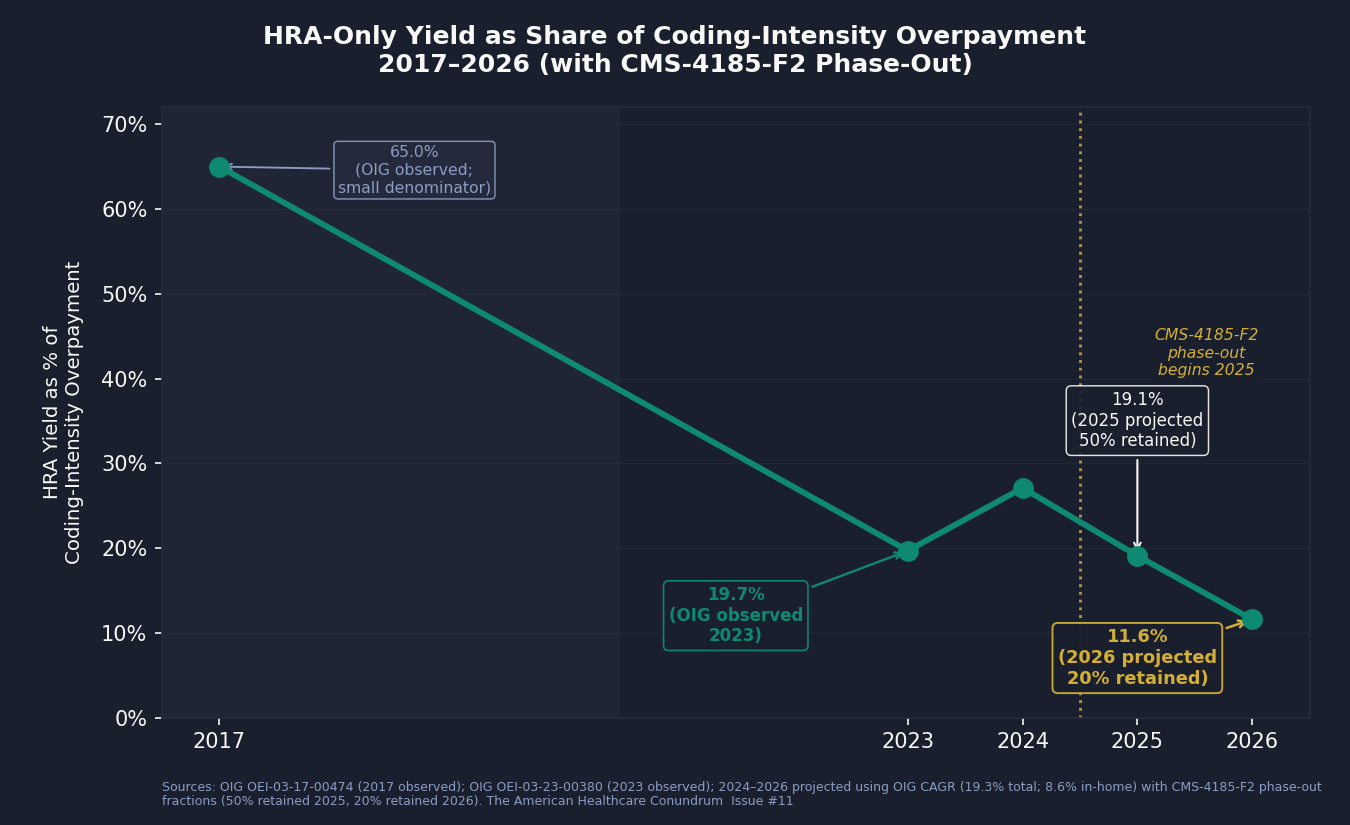
By 2023, the Number Was $7.5 Billion
The OIG followed up in October 2024 with the same analysis for 2023 (OIG OEI-03-23-00380). HRA-only diagnosis payments had grown to $7.5 billion, representing about 19.7 percent of MedPAC's $38 billion coding-intensity attribution that year. The in-home HRA share had fallen to 46 percent ($3.45 billion), but the in-home yield-per-visit remained 5.7 times higher than other modalities: in-home HRAs were 13 percent of HRA visits but generated nearly half the revenue. Thirteen health conditions drove 75 percent of the payments.
Under CMS-4185-F2, we model that 19.7 percent share falling to a projected 11.6 percent by 2026. The HRA visit had become one channel among several long before the phase-out; chart reviews and provider documentation incentive programs had grown alongside it. (In 2017, the OIG-documented $2.6 billion was a large fraction of MedPAC's smaller attribution that year, but the denominator was small enough that the ratio is not a stable trend anchor; the trajectory becomes readable from 2023 onward.)
The CMS-4185-F2 Phase-Out
CMS acted on the OIG findings. The 2026 Medicare Advantage Final Rule (CMS-4185-F2, finalized in 2024) phased out the use of HRA-only diagnoses for risk adjustment: 2025 retained 50 percent of the HRA-only yield; 2026 retained 20 percent.
We projected the HRA yield through the phase-out using OIG's observed compound annual growth rate (CAGR), 19.3 percent annually for total yield and 8.6 percent for in-home yield, and applied the phase-out percentages:
2025 projected HRA yield: $5.3 billion (total), $2.0 billion in-home
2026 projected HRA yield: $2.6 billion (total), $0.9 billion in-home
Under this projection, HRA-only diagnoses represent 19.1 percent of the $28 billion coding-intensity overpayment in 2025, and 11.6 percent of the $22 billion in 2026. The phase-out is working. The mechanism is not eliminated.
The phase-out modeling assumptions (50 percent and 20 percent retained yield) are our modeling, not CMS's published projection. CMS finalized the rule structure without publishing a quantitative reduction estimate. We are transparent about this distinction.
The Math That Should Prompt a Question
The industry response to OIG audits has been a consistent argument: these diagnoses are real, they are clinically accurate, and documenting them is a clinical good. That argument deserves to be answered on the evidence.
The OIG 2024 report found that 13 health conditions drove 75 percent of HRA-only diagnosis payments. These are conditions that, once documented in an HRA, raise the risk score and the monthly capitation payment for the rest of the year, without a corresponding treatment encounter. The yield-per-visit-type ratio (5.7x for in-home versus other) is not a clinical finding. It is an economic finding. The in-home visit is not producing 5.7 times better health assessments. It is producing 5.7 times more revenue-eligible diagnoses per visit. The driver of that ratio is what the visit is designed to find, not the health of the patient being visited.
Where the Dollars Are: State Distribution
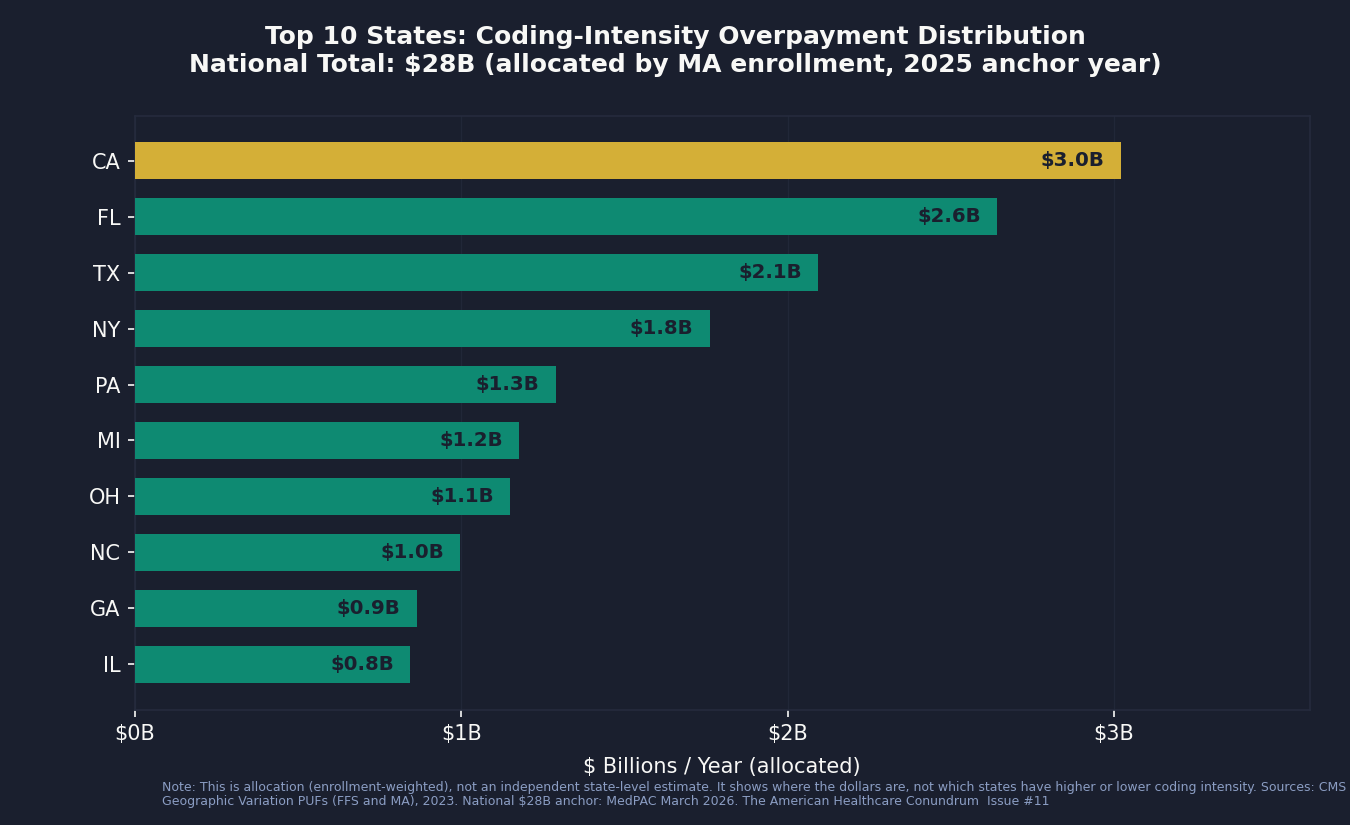
Using state-level MA enrollment counts and FFS risk-score indices from the CMS Geographic Variation Public Use Files, we allocated the national $28 billion coding-intensity overpayment across states. This is allocation, not estimation: it tells you where the dollars are, not which states are doing better or worse on coding intensity.
The dollars follow MA enrollment. California, Florida, and Texas account for roughly 28 percent of the national overpayment because they hold roughly 28 percent of MA enrollees. The per-enrollee figures sit in a narrow $864–$969 range and reflect each state's underlying FFS risk-score level, not plan-specific coding behavior. Identifying states where coding intensity is unusually high or low would require contract-level CCW microdata. The top ten states by allocated coding-intensity overpayment:
California: $3.0 billion (10.8% of national)
Florida: $2.6 billion (9.4%)
Texas: $2.1 billion (7.5%)
New York: $1.8 billion (6.3%)
Pennsylvania: $1.3 billion (4.6%)
Michigan: $1.2 billion (4.2%)
Ohio: $1.1 billion (4.1%)
North Carolina: $1.0 billion (3.6%)
Georgia: $0.9 billion (3.1%)
Illinois: $0.8 billion (3.0%)
What this distribution does tell you is which congressional delegations represent the largest constituent stakes in any reform.
Who Profits
The insurer-level decomposition of the coding-intensity overpayment requires the CMS Chronic Conditions Data Warehouse, a restricted dataset accessible only under a formal data-use agreement. We cannot produce it from public files. What the literature has produced, from Kronick et al. 2025 in Annals of Internal Medicine, is the best published insurer-level breakdown. We cite it directly.
Who Profits: UnitedHealth Group (UNH)
FY2024 Revenue: $400.3B | Operating Margin: 8.2% | CEO Comp (Andrew Witty, through Oct 2025): $26.3M | Stock Buybacks (2020-24): ~$33B | Lobbying (2020-24): ~$43M
This issue's mechanism: Kronick et al. (2025, Annals of Internal Medicine) found that UnitedHealth received $13.9 billion, or 42 percent, of the $33 billion in 2021 differential-coding payments industry-wide. That figure is curated reference data we cite directly because we cannot reproduce the insurer-level decomposition from public files. UNH's vertically integrated structure is the mechanism: Optum's HouseCalls division employs the field staff who conduct in-home health risk assessments; Optum's physician practices submit the encounter data; Optum's analytics platform (now integrated with Change Healthcare) identifies undocumented HCC opportunities across the patient record. UNH controls the visit, the submission, and the analytics layer simultaneously. The Department of Justice (DOJ) has an active civil probe into UNH's Medicare Advantage risk-adjustment practices, reported by the Wall Street Journal (WSJ) in February 2025 and acknowledged publicly by UnitedHealth on July 24, 2025. HHS-OIG has intervened in a second related False Claims Act (FCA) suit. As of publication, no charges have been filed.Who Profits: Humana Inc. (HUM)
FY2024 Revenue: $111.9B | Operating Margin: negative (MA segment operating loss in 2024) | CEO Comp (Jim Rechtin, succeeding Bruce Broussard): ~$16.8M | Lobbying (2020-24): ~$14M
This issue's mechanism: Humana is the most MA-concentrated of the publicly traded insurers. Medicare Advantage is the dominant revenue line, not a side business. That concentration means Humana's financial performance tracks MA risk-adjustment outcomes more directly than any other major publicly traded insurer. When CMS issued its 2024 Final Rate Notice, Humana's stock fell sharply, reflecting market recognition that MA capitation rates are Humana's primary lever. The company has stated publicly that it expects meaningful revenue pressure as V28 phases in, quantifying the per-member capitation reduction in investor disclosures. Humana does not disclose its HRA program volume separately; its MA segment structure makes coding-intensity strategy a core operational variable.
Sources: UnitedHealth Group FY2024 Form 10-K and DEF 14A proxy; Humana Inc. FY2024 Form 10-K and DEF 14A proxy; all via the Securities and Exchange Commission's (SEC) Electronic Data Gathering, Analysis, and Retrieval (EDGAR) system; Kronick R et al., Annals of Internal Medicine 2025, Digital Object Identifier (DOI) 10.7326/ANNALS-24-01345; DOJ press releases as cited; HHS-OIG enforcement announcements; Senator Grassley investigation report (2024); OpenSecrets.org federal lobbying disclosure database (2020-2024).
The Qui Tam Track
The False Claims Act permits private whistleblowers to file suits on behalf of the government and share in any recovery. In Medicare Advantage risk-adjustment fraud, the qui tam track is the part of the mechanism that has already been litigated to closure. It is not the same as the payment-policy overpayment. The two have different epistemic statuses. Both are real.
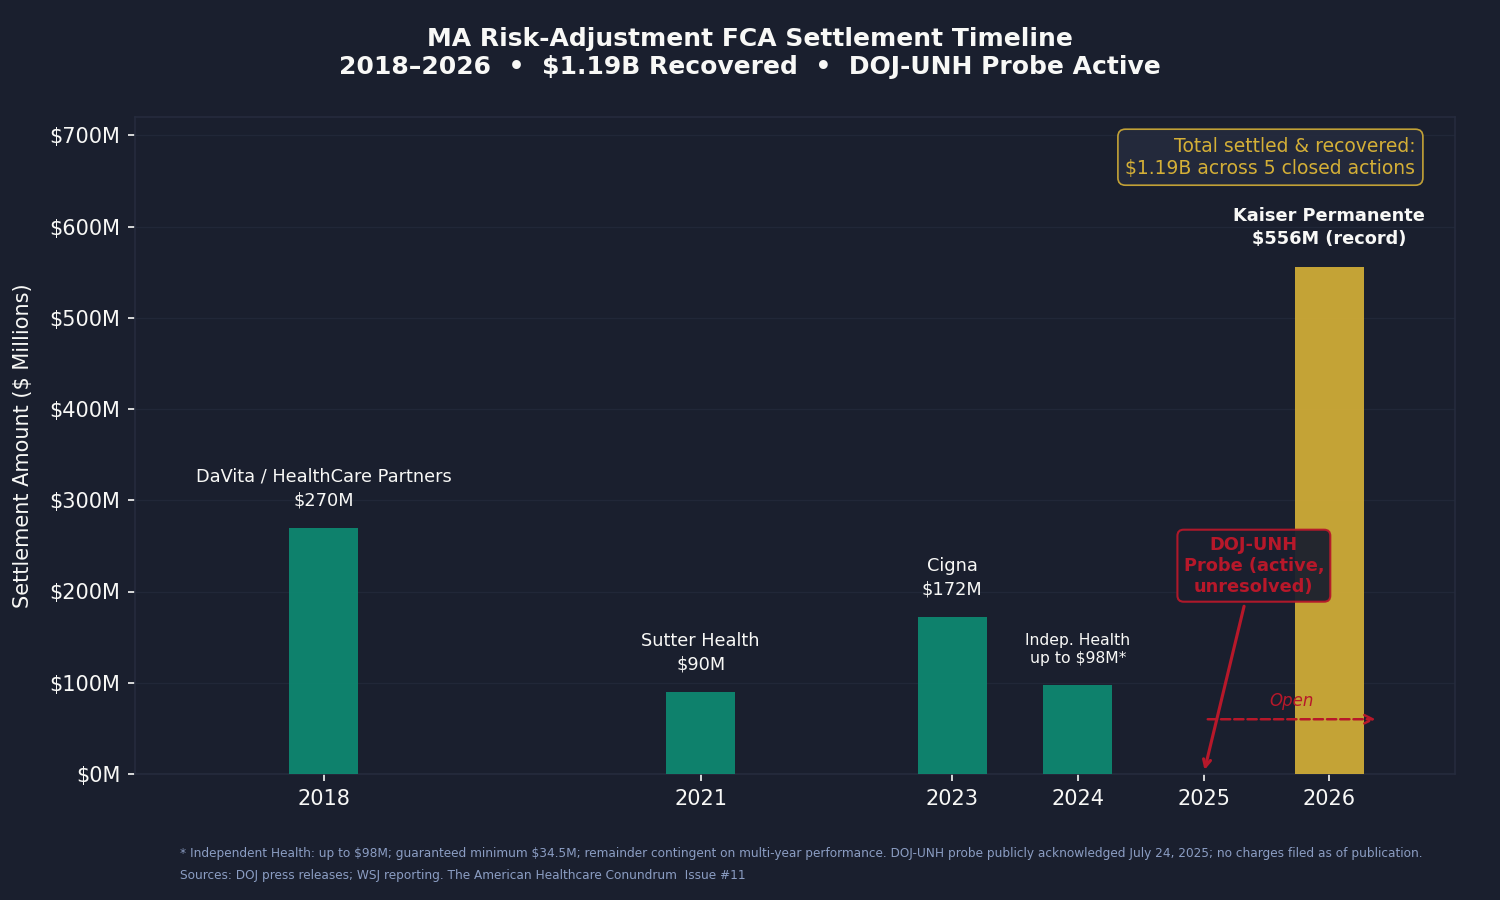
We aggregated the settled and closed MA risk-adjustment FCA actions through April 2026. The total is $1.19 billion.
DaVita / HealthCare Partners, 2018: $270 million. Alleged mechanism: one-way chart reviews and improper diagnosis-code guidance to increase risk scores. DaVita acquired HealthCare Partners in 2012; the conduct alleged in the settlement predated and followed that acquisition.
Sutter Health, 2021: $90 million. Alleged mechanism: diagnosis codes submitted for risk adjustment that were not supported by the medical record. Sutter denied liability as part of the settlement.
The Cigna Group, 2023: $172 million. Alleged mechanism: inflated risk scores through improper diagnosis submissions. Cigna's MA book, now being sold to HCSC, was the relevant business.
Independent Health (and former executive Betty Gaffney), 2024: up to $98 million ($34.5 million guaranteed minimum; the remainder is contingent on multi-year financial performance). Alleged mechanism: inflated risk scores in a regional New York MA plan. The individual executive settlement is notable: it is one of the few MA risk-adjustment FCA cases where a named individual paid separately.
Kaiser Permanente affiliates, 2026: $556 million. This is the record. The DOJ alleged that Kaiser physicians were pressured to add post-visit "addenda" diagnoses between 2009 and 2018, producing approximately 500,000 added diagnoses and approximately $1 billion in improper payments. Kaiser settled for $556 million (approximately 55 percent of the alleged improper-payment total) and denied wrongdoing, as is standard in FCA settlements. The DOJ press release is the source; we do not extrapolate from Kaiser's conduct to other carriers.
The DOJ-UnitedHealth probe is active and unresolved. The civil fraud investigation, reported by WSJ in February 2025, was publicly acknowledged by UnitedHealth on July 24, 2025. HHS-OIG intervened in a second related FCA suit. The scope, as described in public reporting, covers the HouseCalls in-home assessment program, software-suggested diagnosis codes, and provider bonuses tied to diagnosis capture. No charges have been filed as of publication.
We do not apply a detection-rate multiplier to the qui tam total. The $1.19 billion is what has been settled and recovered, not an estimate of total underlying improper payments. The academic literature suggests FCA recovery captures roughly 10 to 20 percent of underlying overpayment, which would imply a $6 to $12 billion underlying improper-payment pool from closed settlements alone. We present that range as context, not as a booked figure.
The Three-Issue Arc
Issues #4, #8, and this one all document extraction by the same five companies (UNH, CVS/Aetna, ELV, CI, HUM). They are not the same dollar three times.
Issue #4 measured PBM extraction from drug spending: the spread pricing, rebate retention, and formulary manipulation that operate on the pharmacy side of the income statement.
Issue #8 measured denial-driven extraction: the dollars not paid in care outlays because prior authorization suppresses utilization, and the margin the insurer captures as a result.
This issue measures MA capitation revenue inflated through risk-score growth. The same insurer can produce margin simultaneously on all three levers, and some of the largest ones appear to. The booked savings across issues #4, #8, and #11 are additive because they measure different cash flows on different parts of the income statement. The companies are the same. The mechanisms are not.
The Fix
The fix-spectrum for coding-intensity overpayment runs from a change CMS could implement administratively in a year, to a structural reform that would require congressional action and would materially change the MA program architecture.
Step 1 (Incremental): Raise the Statutory Coding-Intensity Adjustment
The statutory coding-intensity adjustment has been fixed at its 5.91 percent floor since 2018 by the Affordable Care Act (ACA) Section 3201 and the American Taxpayer Relief Act (ATRA) 2012 schedule. MedPAC's data shows that the observed coding-intensity differential has, in some years, run substantially above 5.91 percent. The residual after the floor is the booked overpayment.
MedPAC has recommended raising the adjustment to match the observed annual differential, with a two-year lookback, in every annual report since at least 2014. Congress has not acted. CMS does not have the administrative authority to raise the floor above the statutory level without legislation. A one-line statutory change would close the gap.
This is the lowest-cost intervention, has the strongest evidentiary support, and has been waiting in MedPAC's recommendation column for more than a decade. That it has not passed reflects the lobbying effectiveness of the MA insurer coalition, not any scientific dispute about the finding.
Step 2 (Medium): Extend and Strengthen CMS-4185-F2
CMS-4185-F2 phases out the use of HRA-only diagnoses for risk adjustment in 2025-2026. The phase-out applies specifically to diagnoses that appear on the HRA but nowhere else in the encounter record. Diagnoses that appear on the HRA and are also linked to a chart review still qualify.
The medium step is to extend the rule:
Remove all diagnoses generated by in-home assessments from risk adjustment regardless of whether they are "confirmed" by a linked chart review. If the diagnosis does not appear in a care-delivery encounter (a treatment visit, a prescription, a referral), it should not adjust the capitation rate.
Require provider attestation on any diagnosis generated by an in-home visit: the physician who submitted the HRA findings must attest that the diagnosis reflects the patient's current clinical status and was reached independently of the coding incentive.
Net additional savings from this step are estimated in the range of $1 to $3 billion annually based on OIG yield numbers, after the phase-out of the HRA-only channel is complete. The structural value is larger than the dollar estimate: it closes the linked-chart-review loophole that is already replacing the HRA-only channel as the primary coding-intensity mechanism.
Step 3 (Structural): Site-Neutral Capitation Indexing
The structural fix is to replace diagnosis-driven risk adjustment with site-neutral capitation indexed to local fee-for-service spending. Under this model, CMS pays MA plans the per-beneficiary equivalent of what traditional Medicare costs locally, adjusted for demographics but not for plan-recorded diagnoses. Plans would be rewarded for managing patient health, not for recording it.
Versions of this proposal have been developed by Robert Berenson at the Urban Institute and appear in various forms in the academic literature on MA overpayment. It would save the full MA-FFS payment differential over time: MedPAC's $76 billion for 2026, not just the $22 billion coding-intensity slice. It would also require restructuring the entire MA payment architecture and would likely reduce plan participation in markets with thin margins.
The structural fix is the one that eliminates the mechanism. Steps 1 and 2 reduce it. All three have a legitimate role in the policy discussion; they are not mutually exclusive.
Who has the power to act:
CMS: Can expand CMS-4185-F2 through rulemaking (Step 2). Cannot raise the statutory floor unilaterally (requires legislation).
Congress: Can raise the statutory coding-intensity adjustment floor (Step 1). Can authorize structural reform of MA payment (Step 3). Has been aware of the MedPAC recommendations since 2014.
DOJ/HHS-OIG: Can continue and expand qui tam enforcement. Kaiser's $556 million settlement and the active UNH probe signal the enforcement posture. Detection without payment-formula reform treats symptoms without addressing the structural driver.
The Part Public Files Cannot Tell Us
The analysis in this issue is computed at the national and state level from CMS public-use files. It cannot tell us which insurers carry the most coding-intensity weight, which provider groups are operating under what documentation incentives, or how the diagnosis yield from a single in-home HRA visit varies across plan and enrollee.
The peer-reviewed paper that has answered the insurer question (Kronick et al., Annals of Internal Medicine, 2025, finding $33 billion in 2021 differential-coding payments with UnitedHealth at $13.9 billion, or 42 percent) used the CMS Chronic Conditions Data Warehouse (CCW), which requires a formal data-use agreement with CMS. The MA plan-payment files, monthly membership reports, and contract-level risk-score microdata are similarly restricted.
Researchers and organizations with CMS Limited Data Set (LDS), Virtual Research Data Center (VRDC), or CCW data-use agreements, or with licensed claims data linked to Medicare (MarketScan with Medicare overlap, Optum Clinformatics with Medicare), can move this analysis from a national estimate to an insurer-by-insurer audit. That is the analysis that would make the insurer-level coding-intensity question answerable from independent data, rather than relying on one paper's CCW results. If you have access and want to collaborate, the contact is: contact@ahcdata.fund.
What's Next
Issue #12: The Consolidation Tax.
The largest hospitals, insurance companies, and physician groups in the US have spent the past decade merging with each other at a pace that would have prompted antitrust review in almost any other industry. Academic research finds that hospital mergers raise prices 7 to 17 percent with no measurable quality benefit. Insurer mergers raise premiums. Physician practice acquisitions shift billing to facility rates; the site-of-service mechanism behind that uplift is the subject of Issue #15. Issue #12 measures the per-market price uplift, with per-transaction granularity available where state All-Payer Claims Databases (APCDs) allow it, and aggregates it across the healthcare sector's consolidation wave.
Every script is on GitHub. Every number can be verified. If you think we got something wrong, open an issue: github.com/rexrodeo/american-healthcare-conundrum
If you found value in this work, forward it to someone who should see it.
Sources: MedPAC March 2026 Report to Congress, Chapter 12 (MA Status Report), Figure 12-6, https://www.medpac.gov/wp-content/uploads/2026/03/Mar26_Ch12_MedPAC_Report_To_Congress_SEC.pdf; MedPAC March 2025 Report to Congress, Chapter 11, https://www.medpac.gov/wp-content/uploads/2025/03/Mar25_Ch11_MedPAC_Report_To_Congress_SEC.pdf; Kronick R, Chua FM, Krauss RC, Johnson L, Waldo D, "Insurer-Level Estimates of Revenue From Differential Coding in Medicare Advantage," Annals of Internal Medicine 178(5):655-662 (2025), DOI 10.7326/ANNALS-24-01345, PubMed ID (PMID) 40194284; Kronick R et al., "Coding intensity variation in Medicare Advantage," Health Affairs Scholar 3(1):qxae176 (2025), PMID 39822237; OIG HHS, "Billions in Estimated Medicare Advantage Payments From Diagnoses Reported Only on Health Risk Assessments Raise Concerns," Report OEI-03-17-00474 (September 2020), https://oig.hhs.gov/oei/reports/OEI-03-17-00474.pdf; OIG HHS, "Medicare Advantage: Questionable Use of Health Risk Assessments Continues To Drive Up Payments to Plans by Billions," Report OEI-03-23-00380 (October 2024), https://oig.hhs.gov/reports/all/2024/medicare-advantage-questionable-use-of-health-risk-assessments-continues-to-drive-up-payments-to-plans-by-billions/; Goldberg EM et al., "In-Home Health Risk Assessments And Chart Reviews Contribute To Coding Intensity In Medicare Advantage," Health Affairs (2024), https://www.healthaffairs.org/doi/10.1377/hlthaff.2023.01530; CMS Final Rule CMS-4185-F2 (2026 Medicare Advantage Final Rule, finalized 2024), CMS Fact Sheet, https://www.cms.gov/newsroom/fact-sheets/medicare-advantage-risk-adjustment-data-validation-final-rule-cms-4185-f2-fact-sheet; CMS Rate Announcement Fact Sheets 2024, 2025, 2026 (CMS website); CMS, "Risk Adjustment in Medicare Advantage," Report to Congress (December 2024), https://www.cms.gov/files/document/report-congress-risk-adjustment-medicare-advantage-december-2024.pdf; CMS Geographic Variation Public Use Files (FFS and MA), data.cms.gov; DOJ press release, "DaVita to Pay $270 Million to Resolve False Claims Act Liabilities" (2018), https://www.justice.gov/archives/opa/pr/medicare-advantage-provider-pay-270-million-settle-false-claims-act-liabilities; DOJ press release, "Sutter Health Pays $90M" (2021); DOJ press release, "Cigna Group to Pay $172 Million" (2023), https://www.justice.gov/archives/opa/pr/cigna-group-pay-172-million-resolve-false-claims-act-allegations; DOJ press release, "Independent Health to Pay $98M" (2024), https://www.justice.gov/archives/opa/pr/medicare-advantage-provider-independent-health-pay-98m-settle-false-claims-act-suit; DOJ press release, "Kaiser Permanente Affiliates Pay $556M" (January 14, 2026), https://www.justice.gov/opa/pr/kaiser-permanente-affiliates-pay-556m-resolve-false-claims-act-allegations; UnitedHealth Group public acknowledgment of DOJ investigation (July 24, 2025), https://www.unitedhealthgroup.com/newsroom/2025/2025-07-24-uhg-responds-to-doj-investigation.html; HHS-OIG enforcement announcement, US intervention in second FCA suit against UnitedHealth Group; Senator Charles Grassley, investigation report on UnitedHealth Medicare Advantage risk-adjustment practices (2024); Geruso M, Layton TJ, "Upcoding: Evidence from Medicare on Squishy Risk Adjustment," Journal of Political Economy 128(3):984-1026 (2020), DOI 10.1086/704756; UnitedHealth Group FY2024 Form 10-K and DEF 14A proxy; Humana Inc. FY2024 Form 10-K and DEF 14A proxy; all 10-K and DEF 14A filings via SEC EDGAR; OpenSecrets.org federal lobbying disclosure database (2020-2024); ACA Section 3201; American Taxpayer Relief Act of 2012 Section 638; Social Security Act (SSA) Section 1853(a)(1)(C)(ii).
Savings Tracker: $470.8 Billion and Counting
$470.8 billion per year in identified, booked, and recoverable waste across eleven published issues of The American Healthcare Conundrum.
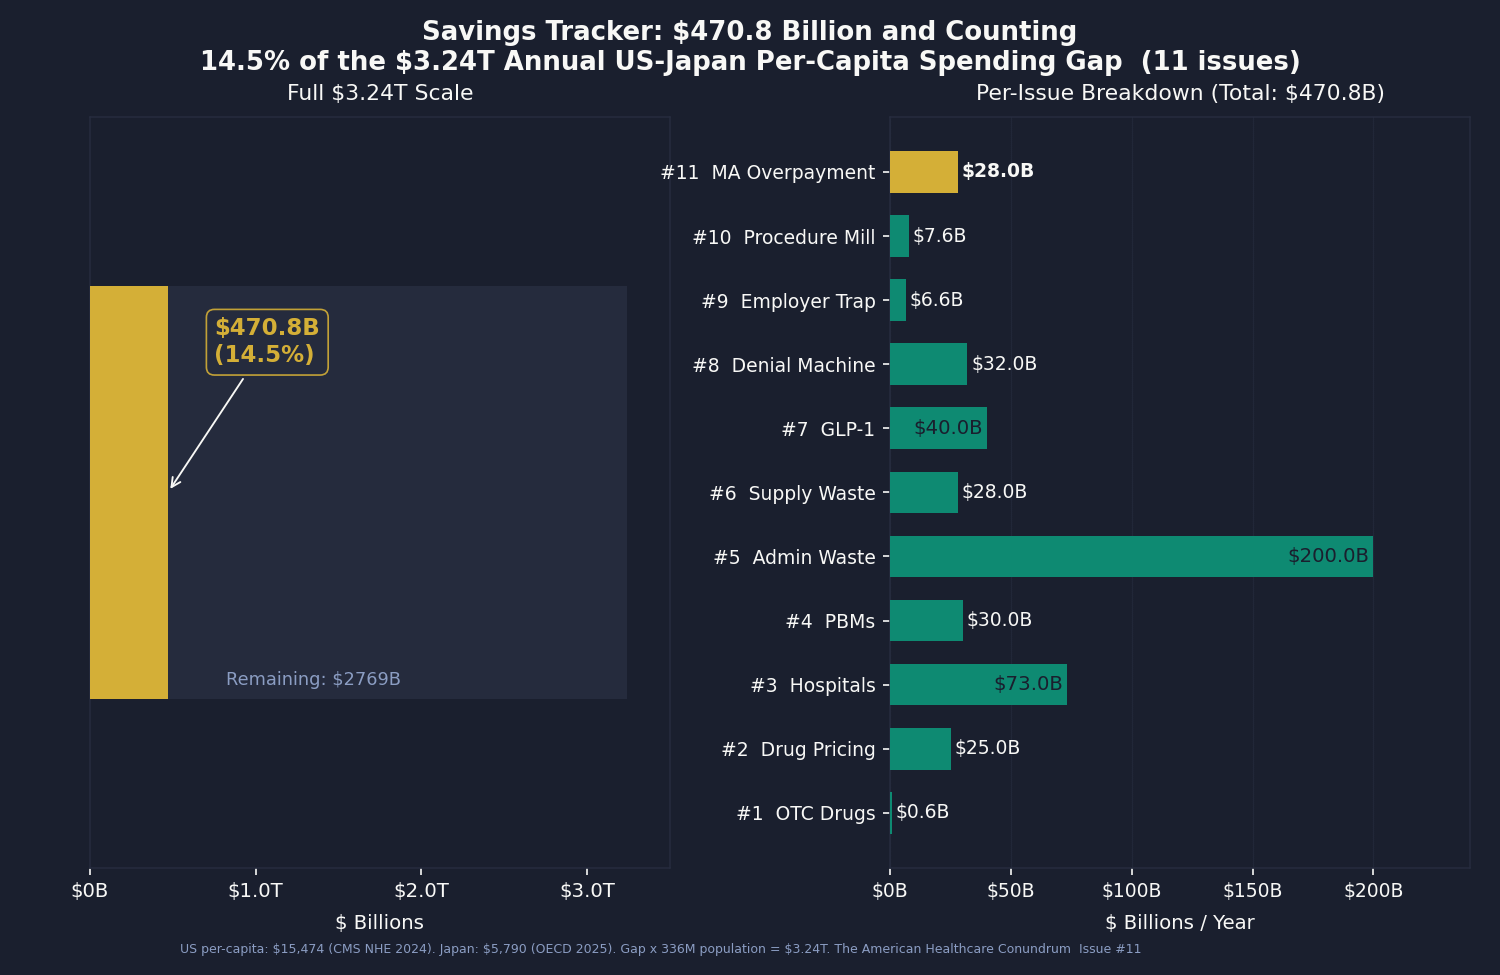
Issue #11 adds $28 billion from Medicare Advantage coding-intensity overpayment. The central estimate matches MedPAC's March 2026 projection for the 2025 anchor year. The analysis includes three components: a V24/V28 sensitivity band ($44.8B applying MedPAC's V24-era share, $19.2B applying the V28-era share for 2025, a $25.6B band width); a HRA-yield projection through the CMS-4185-F2 phase-out (showing that by 2026 the HRA channel represents about 11.6 percent of the coding-intensity figure, down from 19.7 percent in 2023); and a state-level allocation of the national figure by MA enrollment and FFS risk-score weights (California $3.0B, Florida $2.6B, Texas $2.1B leading). The scope is coding-intensity only. Favorable selection ($54B of MedPAC's $76B all-in for 2026) and benchmark structure are documented in the body but not booked here.
Methodology notes for all published issues:
Issue #1 OTC Drugs: $0.6B from Part D coverage of brand drugs with OTC equivalents; CMS Part D Public Use File 2023, step-therapy crosswalk analysis.
Issue #2 Drug Pricing: $25.0B from 9 top-spend Medicare brand drugs versus international prices; CMS Part D Public Use File (PUF) 2023, National Health Service (NHS) Drug Tariff (March 2026), RAND RRA788-3, Peterson-KFF. Net-adjusted at 49% rebate for top-spend brand drugs.
Issue #3 Hospital Pricing: $73.0B from commercial reference pricing at 200% of Medicare (currently at 254%); RAND Round 5.1, CMS HCRIS FY2023 (3,193 hospitals), CMS National Health Expenditure (NHE) 2023.
Issue #4 PBMs: $30.0B from PBM spread pricing, rebate retention, and biosimilar non-adoption gap; FTC Interim Reports I and II, Ohio Auditor data, CMS Part D PDE.
Issue #5 Admin Waste: $200.0B from structural billing complexity and prior auth processing cost; Woolhandler/Himmelstein updated 2023, HCRIS admin variance (4,518 hospitals), AMA PA Survey 2024.
Issue #6 Supply Waste: $28.0B from hospital supply cost variance (Q4 to P75 within peer groups); CMS HCRIS FY2023 Worksheet A (5,480 hospitals).
Issue #7 GLP-1 Pricing: $40.0B from US-to-international price gap in GLP-1 receptor agonists and BALANCE model optimization; CMS NHE, OECD, Novo Nordisk and Eli Lilly filings.
Issue #8 Denial Machine: $32.0B from prior authorization reform, vertical integration restrictions, AI denial regulation, and MA risk adjustment audits; CMS-0057-F, KFF CY2024 Part C data, Health Affairs 2025.
Issue #9 Employer Trap: $6.6B from above-benchmark broker compensation and above-peer admin-fee variance in ERISA health welfare plans; DOL Form 5500 Schedule A and Schedule C 2023 research file.
Issue #10 Procedure Mill: $7.6B from low-value Medicare and all-payer spending on a peer-reviewed 31-service list; CMS Provider Utilization, Hospital Outpatient, Physician/Supplier, and Geographic Variation PUFs (CY2023); Schwartz/Mafi/Choosing Wisely evidence base.
Issue #11 MA Overpayment: $28.0B from Medicare Advantage coding-intensity overpayment (coding-intensity slice only; favorable selection not booked); CMS Geographic Variation PUFs (FFS and MA), MedPAC March 2026 Chapter 12 (cross-validation anchor), OIG OEI-03-17-00474 and OEI-03-23-00380 (HRA yield), CMS Rate Announcement Fact Sheets 2024-2026 (V24/V28 counterfactual inputs).
Denominator: $3.24 trillion US-Japan per-capita spending gap (US per-capita $15,474, Japan $5,790, US population ~336 million; CMS NHE 2024 final, Organisation for Economic Co-operation and Development (OECD) Health at a Glance 2025). The running total at $470.8B represents 14.5 percent of the $3.24T gap.
The American Healthcare Conundrum publishes when the data is ready. All analysis uses publicly available data. Code is open-source. Figures are validated before publication.