
Issue #10: The Procedure Mill
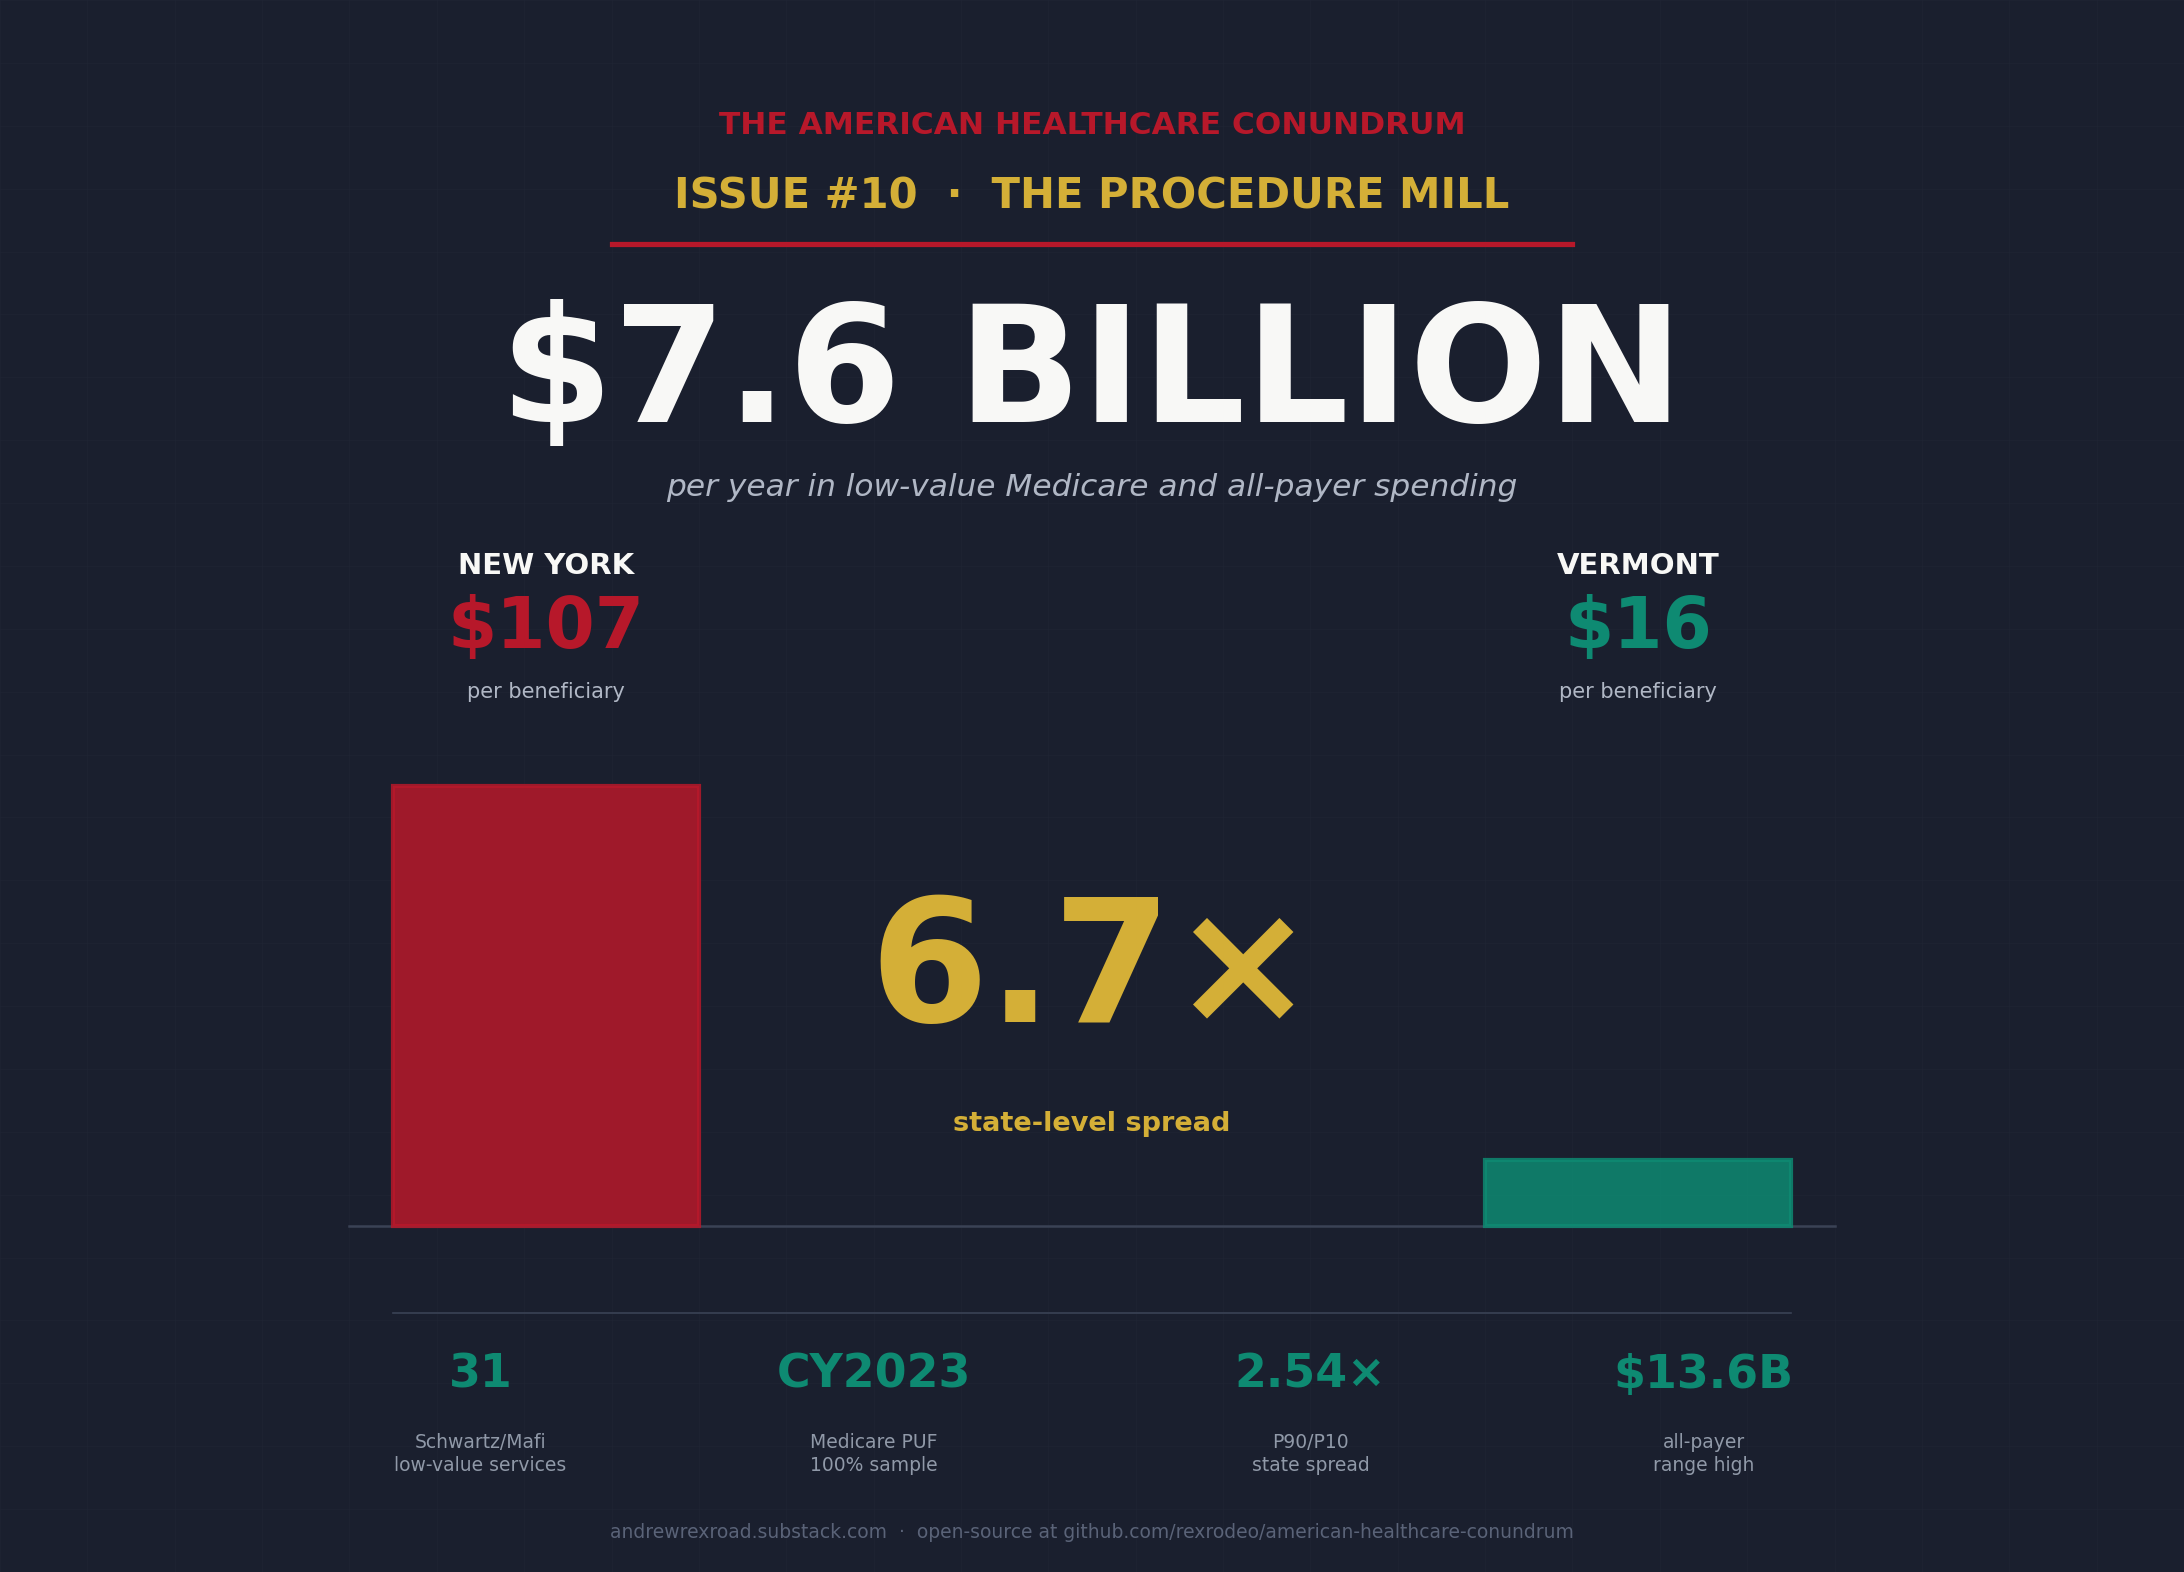
How fee-for-service payment generates $7.6 billion per year in low-value Medicare and all-payer spending, and why New York pays 6.7x what Vermont does for the same evidence-poor procedures

Each issue of The American Healthcare Conundrum identifies one fixable problem in U.S. healthcare spending, builds the data case, and recommends a specific policy fix. All analysis uses publicly available data. Code is open-source.
Target: ~$3.24T US-Japan per-capita spending gap
(Japan: highest life expectancy, lowest infant
 mortality in OECD, ~half US per-capita spend)

Full scale: $0 ───────────────────────── $3.24T
            ████░░░░░░░░░░░░░░░░░░░░░░  13.7%
            ↑ $442.8B identified

Per-issue savings (1 block ≈ $8B; max bar = $200B):
 #1 ▏                          $0.6B   OTC Drug Overspending
 #2 ███                       $25.0B   Drug Pricing
 #3 █████████                 $73.0B   Hospital Pricing
 #4 ████                      $30.0B   PBM Reform
 #5 █████████████████████████ $200.0B  Admin Waste
 #6 ███                       $28.0B   Supply Waste
 #7 █████                     $40.0B   GLP-1 Pricing
 #8 ████                      $32.0B   Denial Machine
 #9 █                          $6.6B   Employer Trap
#10 █                          $7.6B   Procedure Mill (this issue)
   ───────────────────────────────────────────────
   Total: $442.8B  ·  $2,797.2B remaining
   Scale: $3.24T (CMS NHE 2024; Japan OECD 2023)
The 6.7x Question
Medicare pays $106.72 per beneficiary every year for a specific set of low-value services in New York. In Vermont, Medicare pays $16.00 for the same category of services. That is a 6.67x gap.
New York and Vermont have broadly similar Medicare populations. They have similar rates of chronic illness. They have comparable beneficiary counts relative to their populations. What they do not have is the same practice pattern.
Take back imaging for nonspecific low back pain. A Medicare patient shows up at a primary care office. The back has hurt for three weeks. There are no red-flag symptoms: no bowel or bladder changes, no focal neurological deficit, no fever, no history of cancer. The evidence says clearly that imaging in this context does not change outcomes, does not speed recovery, and frequently triggers a cascade of downstream tests and procedures. The American College of Radiology's Appropriateness Criteria and every major Choosing Wisely list since 2012 say the same thing: do not image in the first six weeks unless red flags are present.
Medicare paid for that imaging anyway. In CY2023, back imaging for nonspecific low back pain cost Medicare $170 million across the 22 HCPCS codes we identified. That is one service, on one list of 31 services the evidence says should not be ordered for most patients in most clinical contexts.
The question is why these services happen at a 6.7x rate per beneficiary in some states versus others. Population health does not explain a 6.7x spread in services that the evidence says should not be ordered for most patients at all. The Dartmouth Atlas has documented for thirty years that geographic variance in utilization persists after controlling for population health. That literature is specifically about services that are appropriate in some patients. The Schwartz list we computed is specifically about services the evidence does not support for most patients. A 6.7x spread in services that are already supposed to be rare is harder to explain away.
This issue computes what that spread costs.
What CMS Already Did, and What Lown Already Framed
In November 2025, CMS finalized a rule reducing Medicare payments for skin substitute applications by $19.6 billion annually, effective CY2026. The agency's own language was direct: current utilization "exceeds clinically reasonable levels." The rule is CMS-1832-F. The $19.6 billion is the agency's own accounting of what one narrow category of low-value spending costs the program.
That single category is roughly $12 billion more than Issue #10's booked headline. Which means either CMS identified a uniquely large category of waste, or the broader low-value-care universe is much larger than what we are able to measure from public data. Probably both.
The Lown Institute has estimated $75 to $100 billion per year in low-value care across the US healthcare system. The Lown estimate aggregates across many definitions of low value: services with no clear benefit, services where harms outweigh benefits, services appropriate for one population that migrate to the general population. It is a macro frame, not an operationalized computation.
This issue is the operationalized subset.
What Kim and Fendrick Already Showed
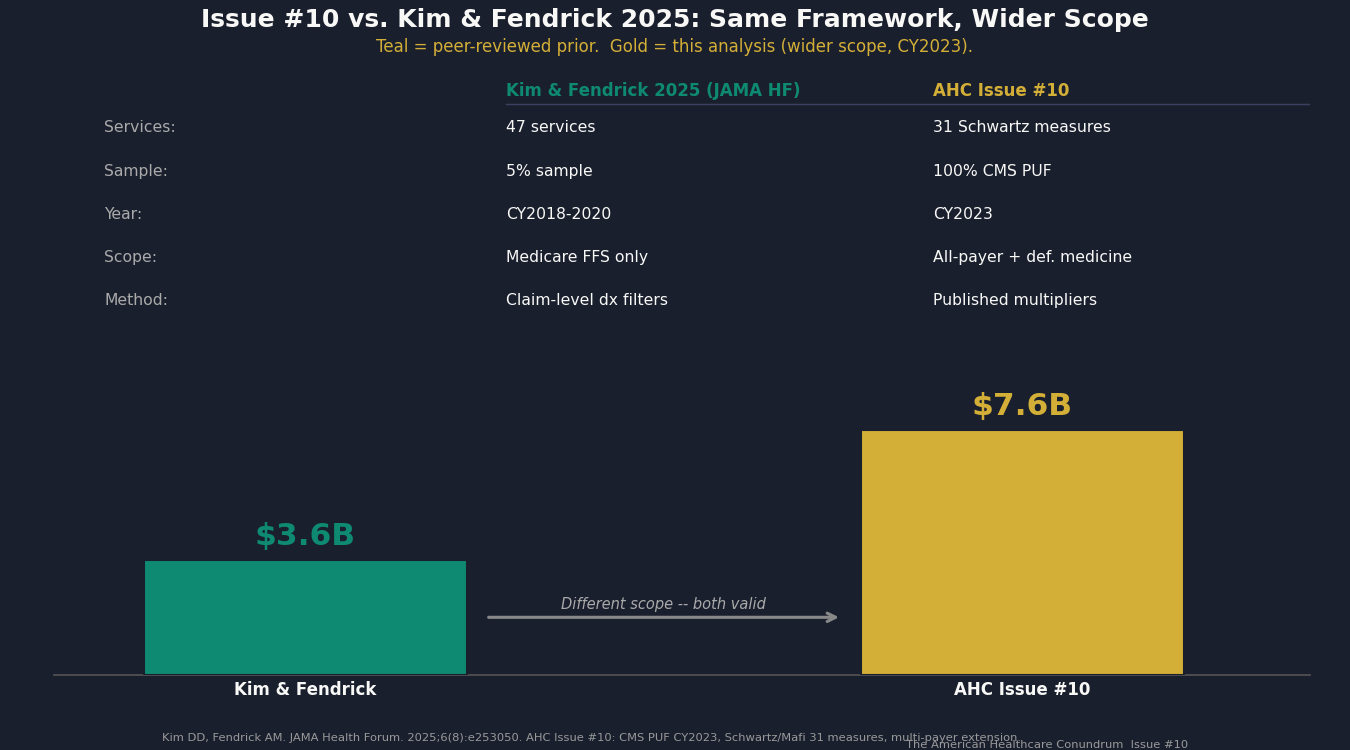
In August 2025, researchers Daniel Kim and A. Mark Fendrick published "Projected Savings From Reducing Low-Value Services in Medicare" in JAMA Health Forum. Using a 5% random sample of CY2018-2020 Medicare fee-for-service claims and a list of 47 low-value services, they found $3.6 billion in annual Medicare payments for low-value care ($4.4 billion including patient cost-sharing).
That is the most recent peer-reviewed prior estimate before this issue. It is the benchmark we are extending.
Four ways Issue #10 builds on Kim and Fendrick:
Full sample. We used 100% of the CY2023 CMS Provider Utilization and Payment Data PUF (268,634 rows), compared with their 5% sample of CY2018-2020 claims. The calendar-year update alone matters: skin substitute spending grew approximately 40x between 2019 and 2024, and several other procedure-mill categories shifted materially post-COVID.
HRR-level variance. Kim and Fendrick reported national totals. We computed state-level spending per beneficiary and found the 6.7x spread. The Schwartz et al. 2014 original paper had computed HRR-level variance on 2009 data (P5-P95 spread of 1.84x). The CY2023 update finds a P90/P10 spread of 2.54x at the state level, materially wider than the 2009 baseline.
All-payer extension. Kim and Fendrick computed Medicare fee-for-service only. We extended to Medicare Advantage, commercial insurance, and Medicaid using published multipliers from MedPAC and RAND Round 5.1.
Live policy bridges. We computed the WISeR pilot-state pool (17 procedures, 6 pilot states) from CY2023 PUF data. No savings projection from CMS exists yet; the Q3 2026 readout will provide the first government evidence. We also ran the defensive-medicine difference-in-differences analysis across three control-state specifications, the results of which we describe honestly below.
The relationship between their $3.6B Medicare-FFS figure and our combined $7.6B booked headline reflects the different scope: our list is 31 Schwartz measures (not 47), our approach does not apply claim-level diagnosis-code filtering (which would lower our count), and we add all-payer extension and the defensive-medicine component. We explain the gap in the methodology section.
What We Computed
The List: 31 Services
We didn't invent the list.
It is the standard one health-services researchers have built and refined since 2014: 31 services, each anchored to a specific randomized controlled trial or USPSTF recommendation. It is a subset of the broader 600-service Choosing Wisely list, narrowed to the services that can be detected directly from Medicare billing data. The full list, the billing codes, and the detection logic are in the public repo.
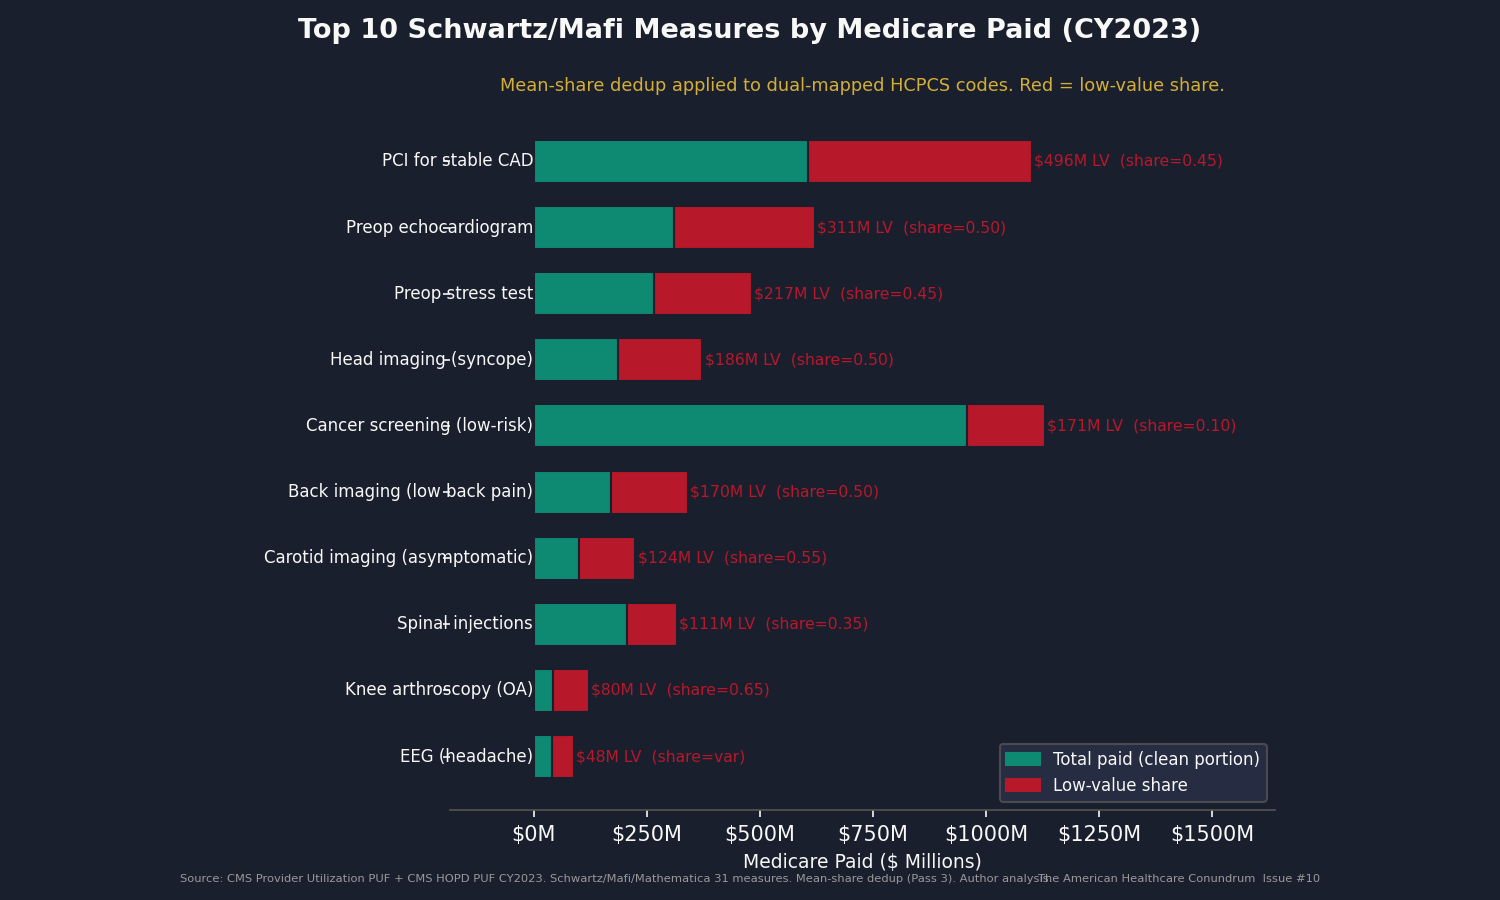
Five of the highest-impact measures, to give the list texture:
PCI for stable CAD: Percutaneous coronary intervention for stable coronary artery disease. The COURAGE trial (NEJM, 2007) and ISCHEMIA trial (NEJM, 2020) both found that medical therapy alone produces outcomes equivalent to PCI for stable patients. We apply a 45% low-value share to unconditional HCPCS spend: $496 million in Medicare-paid annually.
Preoperative echocardiogram: Echo before low-risk surgery. No outcome benefit documented in the evidence base for low-risk procedures. We apply a 50% low-value share: $311 million in Medicare-paid annually.
Head imaging for syncope: CT or MRI of the head to evaluate fainting without focal neurologic symptoms. The American College of Emergency Physicians Choosing Wisely list: do not image. We apply a 60% low-value share: $224 million annually.
Back imaging for nonspecific low back pain: As described above. We apply a 50% low-value share: $170 million annually.
Preoperative stress test: Stress testing before low-risk surgery. American Society of Anesthesiologists guidance and multiple Choosing Wisely recommendations oppose routine pre-op stress testing. We apply a 50% low-value share: $241 million annually.
The full 31-measure list and HCPCS crosswalk are in the public repo.
The Dedup Correction: How We Found Our Own Bug
Our first pass through the data produced a Component A of $2.67 billion.
Then we checked the cross-measure HCPCS overlap.
The Schwartz/Mafi detection logic distinguishes measures by diagnosis context. HCPCS code 0146T (a nuclear stress test) appears in both the preopst (preoperative stress test) measure and the stress (stress test for stable CAD) measure. In the original claims-based methodology, a claim is assigned to one measure or the other based on what diagnosis codes appear on it. Our Pass 1 analysis operated without diagnosis codes, so it assigned the same HCPCS-level Medicare paid to both measures and counted it twice when summing.
We found 106 HCPCS codes (45.5% of the 233 in the Schwartz list) that map to two measures. The double-count amount was $583 million.
We fixed it. Then we caught a second issue.
Our Pass 2 fix used the higher of the two possible "share unnecessary" estimates for each ambiguous code, on the theory that picking the higher number was the conservative choice. It wasn't. Picking the higher of two possible shares for a code whose real-world use sits somewhere between them inflates the count. Pass 3 uses the average of the two instead, which is the most defensible point estimate when we don't have the data to weight one over the other. We also report both ends of the range as bounds, so a reader can see how much the choice matters.
All three runs are in the public repo. The code documents every version. We do not hide the first or second pass.
Component A (CY2023 Medicare fee-for-service, 31 services, averaged across ambiguous codes): $2.09 billion. The range across our two methodology choices is $1.96 billion to $2.21 billion.
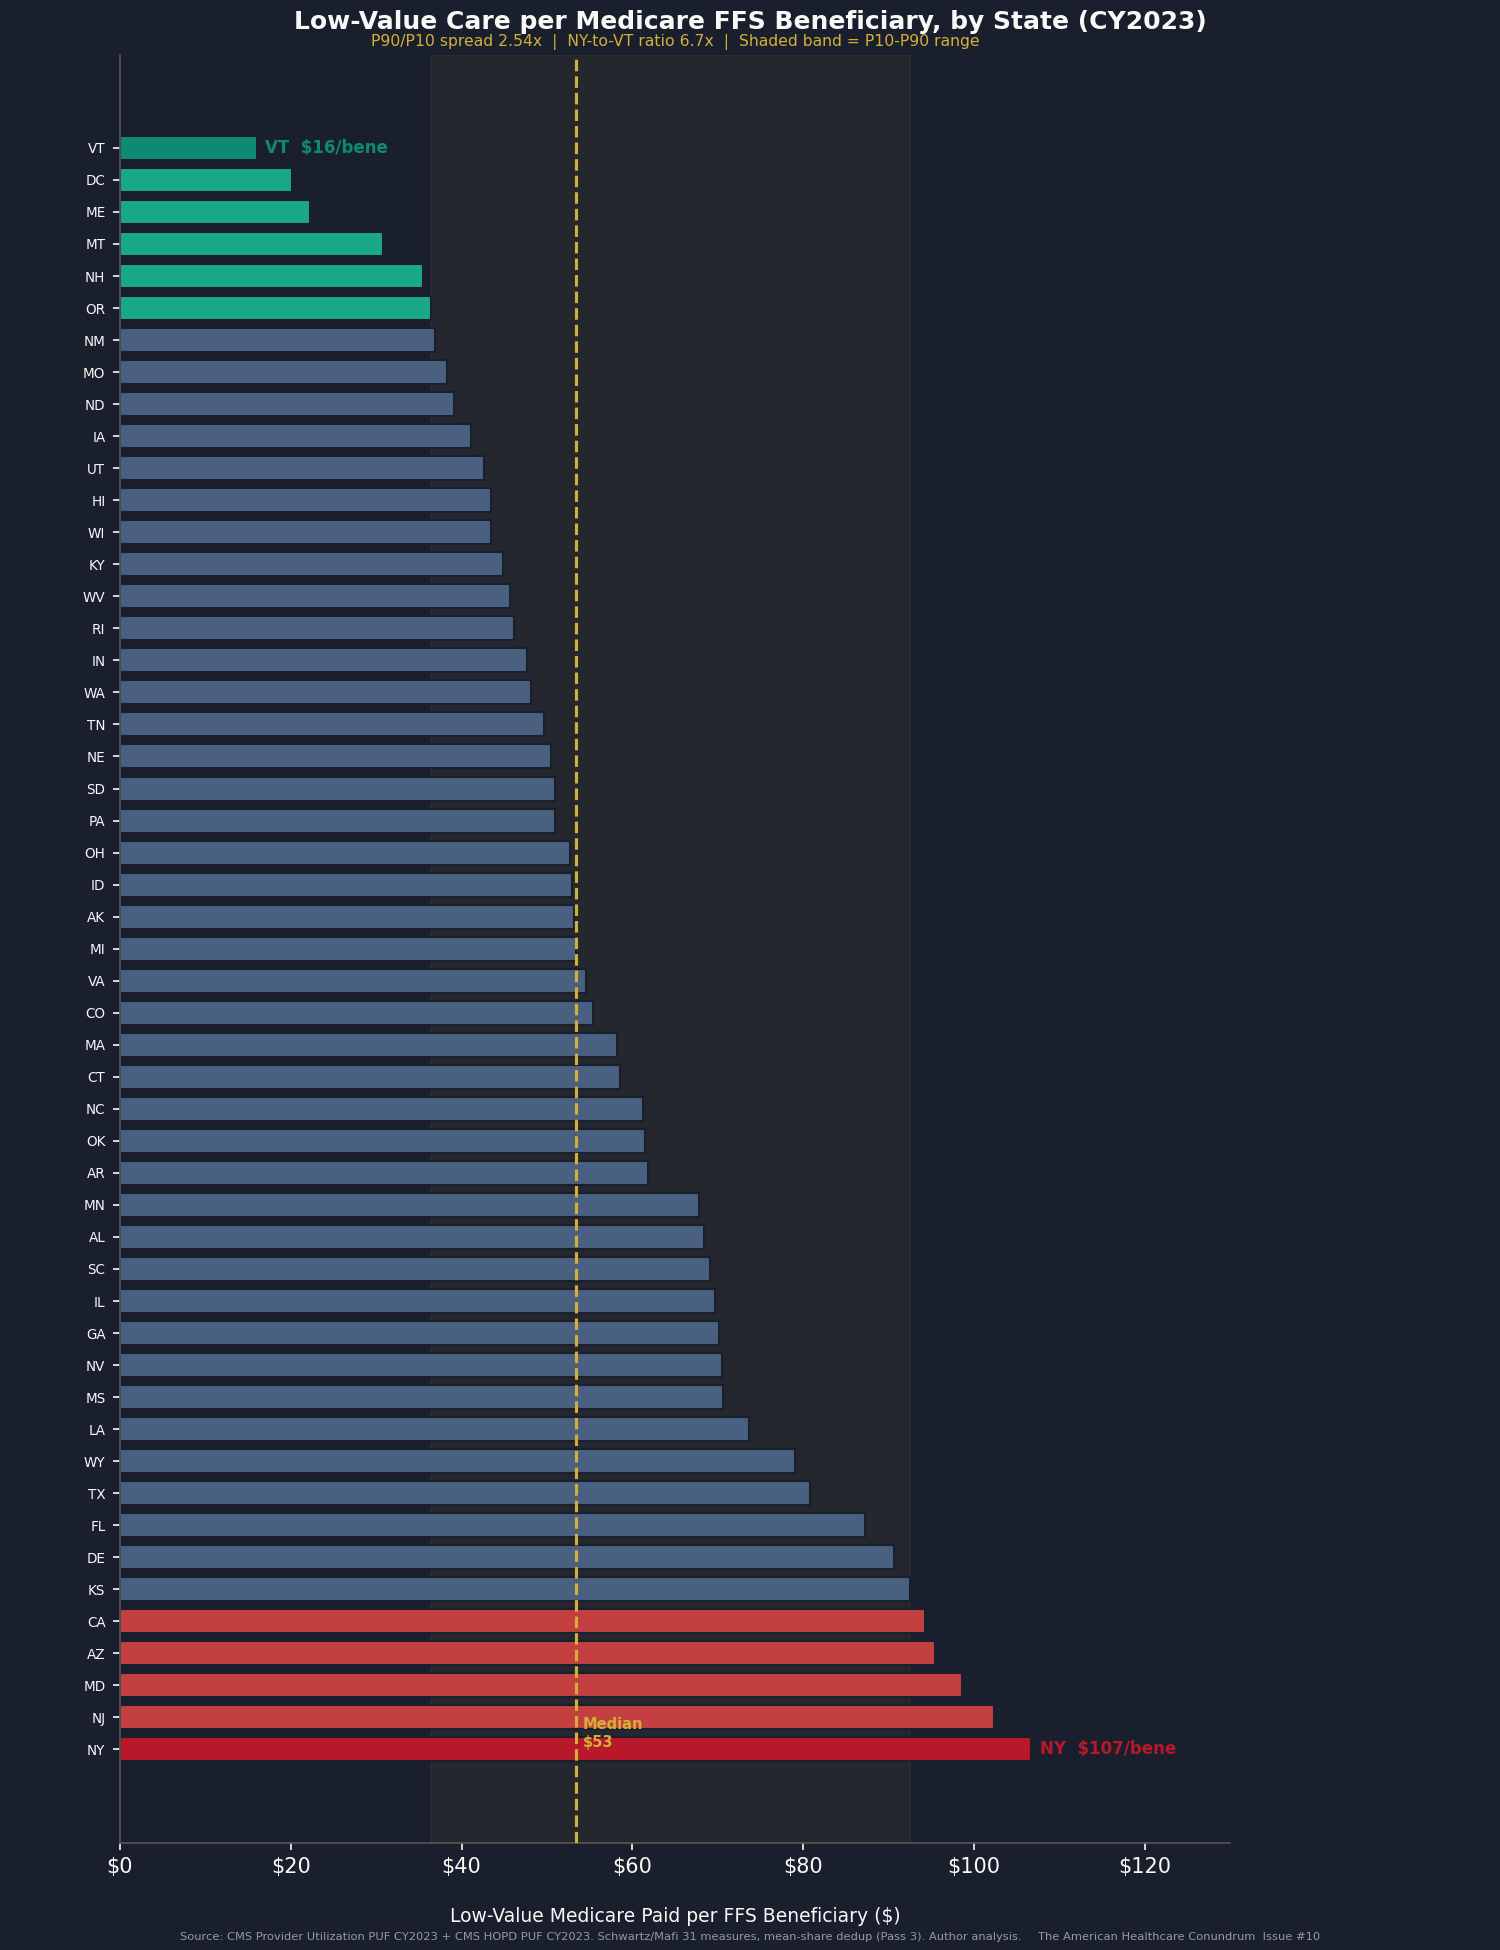
The Variance
The state-level distribution is where the story is.
The national per-beneficiary figure is $53.42. But the distribution is not normal.
P10: $36.41 per beneficiary
P25: $44.00 per beneficiary
P50: $53.42 per beneficiary
P75: $69.50 per beneficiary
P90: $92.50 per beneficiary
P90/P10 ratio: 2.54x
Top three states: New York ($106.72/beneficiary), New Jersey ($102.31/beneficiary), Maryland ($98.59/beneficiary).
Bottom three: Maine ($22.20/beneficiary), DC ($20.19/beneficiary), Vermont ($16.00/beneficiary).
An obvious objection: geography reflects different patient populations. The Northeast has more chronic illness, more urban hospitals, more complex patients than rural states. True, but the Schwartz list isn't measuring care for the most-complex patients. It's measuring services the evidence says should not be ordered for most patients in any state. The Dartmouth Atlas has shown for thirty years that geographic variation in procedure rates persists even after you account for differences in patient health. That finding hits even harder when applied to a list of services that should already be rare.
Component B (compress-to-P25 counterfactual within state distribution): $0.75 billion in additional Medicare savings if every above-P25 state reached the P25 rate. This is not stacked on top of Component A; it is a redistribution calculation within it, presented separately.
All-Payer Extension
Components A and B are Medicare fee-for-service only. That covers about 47% of Medicare beneficiaries; the other 53% are in Medicare Advantage. Add Medicaid and commercial insurance, and the full payer mix gets bigger.
To extend to all payers, we applied published price multipliers: commercial insurance pays more than Medicare for the same service, Medicaid pays less, and Medicare Advantage pays a bit less than fee-for-service. The exact multipliers come from RAND, KFF, MedPAC, and the published health-economics literature (full citations in Sources).
One careful note. Issue #3 found that commercial insurance pays 254% of Medicare on average for hospital procedures. We deliberately did not apply that 2.54x multiplier here, because most Schwartz-list services are billed in doctor's offices and labs, not hospital outpatient departments. The doctor's-office multiplier is closer to 1.5x. Using the higher hospital number would inflate the commercial bill for a list dominated by office-based care.
Component C (extending to Medicare Advantage, commercial insurance, and Medicaid): $4.41 billion.
The WISeR Pilot Pool
Component D (WISeR pilot-state pool, after netting overlap with Component A): $0.03 billion booked. The CMS WISeR pilot is the live policy intervention testing exactly the mechanism this issue describes. We discuss the pilot in detail in the WISeR Bridge section below. The booked share is small because most of the WISeR procedures already overlap with the Schwartz measures counted in Component A; netting the overlap out leaves only a sliver.
The Defensive-Medicine Test
The defensive-medicine hypothesis holds that physicians order unnecessary tests to protect against malpractice liability. If true, states that cap noneconomic damages should show lower per-beneficiary procedure spending than states that do not.
We tested this. We compared per-beneficiary Medicare spending in Texas (which capped malpractice damages in 2003) and Florida (same year) to spending in similar states that did not cap, before and after the cap took effect. We ran the comparison three different ways with three different sets of control states, following the standard method established by economist Michael Frakes in a 2013 American Economic Review paper.
The results were not what we expected.
Across all three comparisons, the average signal was -3.1%: cap states spent slightly more per Medicare beneficiary, not less. Two of three control-state sets showed the opposite of what the defensive-medicine hypothesis predicts. One set (neighboring non-cap states) showed a small positive effect of about $157 per beneficiary per year, but not consistent across the others.
We did not spin this. We booked Component E at the low end of the defensible range.
Component E (defensive medicine, booked at low end given the inconsistent test result): $1.10 billion. The upper bound for the category is roughly $74 billion, which is the most-cited estimate of all-payer defensive medicine (Mello et al., Health Affairs, 2010, brought to current dollars using the standard medical inflation index). Our test suggests that tort reform compresses defensive practice modestly at best, and that the procedure mill persists in cap states. Defensive medicine is part of the picture. The payment system is the larger part.
Booked Headline
Component A  Medicare fee-for-service, 31 services on the list  $2.09B
Component B  State-variance compression (within A, not stacked)     —
Component C  Extension to commercial + Medicaid + MA            $4.41B
Component D  WISeR pilot pool (after netting overlap)           $0.03B
Component E  Defensive medicine, low end of range               $1.10B
                                                                 ------
Booked headline                                                  $7.63B
Range high                                                      $13.62B
The $13.62B range high reflects full multiplier sensitivity and the upper end of the defensive-medicine range. The gap between $7.63B and Lown's $75-100B macro estimate is real and we explain it below.
The WISeR Bridge
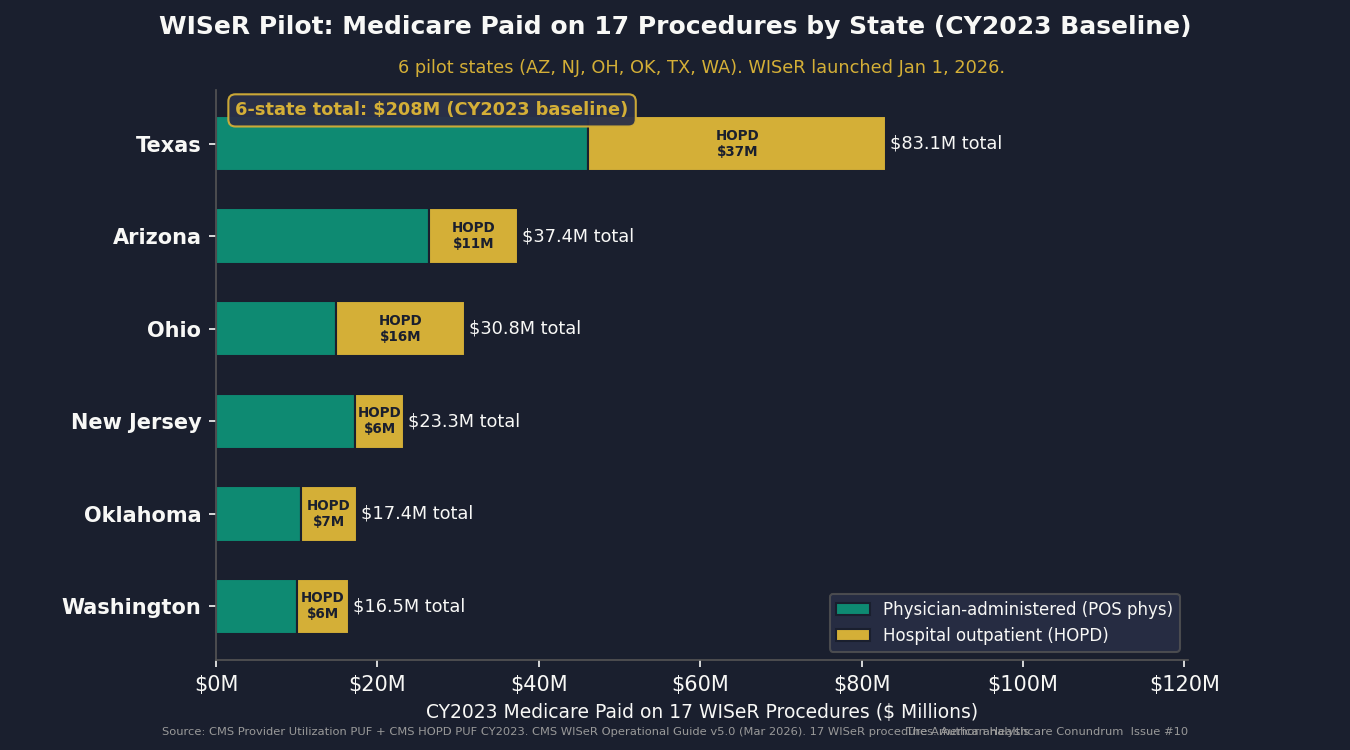
CMS is testing the mechanism described in this issue right now.
The Waste in Spending Reduction Model (WISeR) launched January 1, 2026, in six pilot states: Arizona, New Jersey, Ohio, Oklahoma, Texas, and Washington. It covers 17 procedures selected by CMS as categories where Medicare spending exceeds clinically appropriate levels. Participating hospitals in those states face payment adjustments when they perform those procedures above a defined threshold.
The CMS WISeR Fact Sheet states that Medicare spent $5.8 billion in 2022 on "unnecessary or inappropriate services with little to no clinical benefit" across these 17 procedures nationally. That $5.8B is the agency's own prior-year figure for the procedures WISeR targets.
We computed the 6-pilot-state share of national Medicare spending on those 17 procedures from the CY2023 Provider Utilization PUF. After netting out overlap with the Schwartz measures already counted in Component A, the pilot pool represents $0.03 billion in our booked estimate. It is small not because WISeR is small, but because most of the WISeR-Schwartz overlap is already captured in Component A.
What matters about WISeR is not the number. It is the mechanism.
CMS is applying targeted, transparent, evidence-based criteria to a specific list of services in a defined set of states. That is the policy model we recommend in Step 3 of the Fix below. The Q3 2026 readout will be the first government data on whether targeted volume management on Schwartz-overlap services produces savings without harming access. This issue will update accordingly.
The Honest Math
The gap between $7.63B booked and Lown's $75-100B macro frame is not a flaw in the methodology. It is the methodology being honest about what public data can and cannot support.
Four specific constraints produced the gap:
Narrower service set. The Schwartz/Mafi/Mathematica 31-measure list is one peer-reviewed operationalized subset. Lown aggregates across all definitions of low value, including services the Schwartz list does not operationalize.
Conservative measure resolution. We applied published low-value-share multipliers from the Schwartz, Mafi, and Choosing Wisely evidence base. We did not apply claim-level diagnosis-code filtering, which would allow us to precisely exclude the clinically appropriate uses of each HCPCS code from the count. Without diagnosis codes in the public PUF, we apply a blanket share. That share is already discounted to be conservative.
FFS-only headline with published-multiplier extension. Kim and Fendrick used claims-level data with diagnosis codes. We used the public summary PUF and applied multipliers. The extension from Medicare FFS to all-payer is sound methodology with documented sources; it is not the same as computing each commercial and Medicaid claim directly.
Defensive medicine booked at low end. The empirical DiD signal is opposite-sign for the defensive-medicine hypothesis. We booked $1.10B, the low end of the published modeling range with the BLS-corrected medical CPI factor. The upper modeling range ($5.5B) would be available if the DiD had confirmed the hypothesis.
The data partnerships that would close the gap fall into three groups.
CMS restricted-access Medicare data. The federal government holds claim-by-claim Medicare records with diagnosis codes attached. This is the data we wish we had. Researchers can apply for access through ResDAC, at a cost of roughly $4,800 to $15,000 per year. With it, we could apply the diagnosis-code filters the Schwartz methodology was designed around, instead of the blanket share we used.
Commercial claims data. Three companies — Merative MarketScan, Optum Clinformatics, and IQVIA Pharmetrics — license commercial-insurance claims with the same level of detail. Access is institutional and expensive.
State all-payer claims databases. Colorado, Massachusetts, Washington, and New York each maintain databases that combine commercial, Medicaid, and Medicare claims for everyone in the state. Some are free for public-policy research; others require an application.
Any of these would let us replace the published multipliers with direct, claim-by-claim computation.
The gap between $7.63B and $75-100B is what those partnerships would prove. If you have access to any of these datasets, or an active DUA for the above: ahcdata.fund / contact@ahcdata.fund.
Who Profits
Procedural volume is the revenue model for a segment of the healthcare industry. Fee-for-service payment rewards volume. The Schwartz list is, in most cases, not composed of services ordered for financial gain by individual clinicians. It is composed of services that flow naturally from a system that pays more to perform a test than to explain to a patient why the test is not indicated.
Three companies whose business models are directly aligned with Schwartz-list procedural volume:
Who Profits: HCA Healthcare (HCA)
FY2025 Revenue: $75.6B | Operating Margin: ~14% | CEO Comp (Sam Hazen): $26.5M | Stock Buybacks (2020-24): ~$8-10B
This issue's mechanism: HCA's network of 190 hospitals (179 acute, 7 behavioral, 4 rehab), 121 freestanding outpatient surgery centers, and aligned physician practices generates margin from procedure volume. Preoperative testing, outpatient imaging, and procedure-based care account for a substantial share of what flows through HCA's facilities. As Issue #3 documented, commercial insurance pays roughly 2.5x what Medicare pays for the same hospital procedures. Services on the Schwartz list that flow through HCA's hospital outpatient billing pick up that same multiplier. HCA's internal referral pathways, connecting its hospitals, surgery centers, and physician groups, create institutional alignment between procedure volume and consolidated operating margin. HCA 10-K FY2025, filed February 10, 2026, SEC EDGAR CIK 0000860730.Who Profits: Tenet Healthcare (THC)
FY2025 Revenue: $21.3B (Tenet consolidated) | USPI Segment Revenue: ~$5.2B | Operating Margin: ~8.5% | CEO Comp (Saum Sutaria): $18.4M
This issue's mechanism: Tenet's United Surgical Partners International (USPI) subsidiary operates 533 outpatient surgery centers (401 consolidated, 132 unconsolidated), the largest such network in the US. Surgery centers are a high-margin setting for many of the procedures on the Schwartz list: knee arthroscopy for osteoarthritis, pain-management injections, selected preoperative assessments. USPI grew its procedure volume year-over-year in FY2025 under a payment model that pays per procedure, regardless of whether the ordering physician had clinical evidence on their side or simply a fee-for-service incentive. The distinction matters at the patient level. It does not change the billing. Tenet 10-K FY2025, filed February 17, 2026, SEC EDGAR CIK 0000070318; Tenet DEF 14A filed April 16, 2026.Who Profits: RadNet (RDNT)
FY2025 Revenue: $1.84B | Operating Margin: ~5% | CEO Comp (Howard Berger): $8.1M
This issue's mechanism: RadNet operates 418 outpatient imaging centers across nine states. Imaging is the single-largest category on the Schwartz list by number of distinct services: back imaging for low back pain, head imaging for syncope, head imaging for headache, sinus CT for uncomplicated rhinosinusitis, carotid imaging in asymptomatic adults, and several preoperative imaging measures. RadNet's business model is scan volume multiplied by reimbursement rate. The Schwartz back-imaging and head-imaging measures represent meaningful per-scan volume for a network of RadNet's scale. RadNet's AI subsidiary (DeepHealth) is positioned to expand the addressable scan pool through automated ordering support. RadNet 10-K FY2025, filed March 2, 2026, SEC EDGAR CIK 0000790526; RadNet DEF 14A filed April 20, 2026.
Sources: HCA Healthcare (HCA) FY2025 Form 10-K and 2026 DEF 14A Proxy Statement; Tenet Healthcare (THC) FY2025 Form 10-K and 2026 DEF 14A Proxy Statement; RadNet (RDNT) FY2025 Form 10-K and 2026 DEF 14A Proxy Statement; all via SEC EDGAR (data.sec.gov). Federal lobbying disclosures via OpenSecrets.org (2020-2024 cycles). CEO compensation from DEF 14A Summary Compensation Table.
The Fix
The procedure mill has four structural drivers. The fix addresses each in turn.
The villain is fee-for-service payment. Medicare pays physicians on a points-based fee schedule, where a 30-minute procedure earns more points than a 30-minute conversation. The committee that advises Medicare on those point values has historically been dominated by specialists whose own income depends on the procedure-heavy codes. This is not an accusation against individual physicians. It is a description of how the payment system allocates incentives.
Four steps, in increasing order of intervention:
Step 1: Make Choosing Wisely actionable in the EHR.
The EHR defaults are the immediate intervention point. Today, ordering a back MRI for nonspecific low back pain is one click. Ordering "watchful waiting and physical therapy" requires navigating away from the default order set. Fix step 1 reverses that: Choosing Wisely-aligned pathways are the default, and the physician must actively override to reach the low-value alternative. Override remains available. Override is logged, not punished. The patient retains all rights.
Several health systems, including Intermountain, Geisinger, and elements of Kaiser, have implemented EHR decision-support for selected Choosing Wisely measures. The evidence shows modest but real reductions in ordering rates without measurable quality impacts. The intervention is voluntary, physician-led, and carries no coverage denial.
Step 2: Pay for thinking as well as Medicare pays for procedures.
The structural fix is to narrow the gap between what Medicare pays for procedures and what it pays for cognitive work, like care-management conversations or coordinating across specialists. A discussion that prevents a patient from needing a pre-op stress test should pay closer to what the stress test itself pays. The 2026 Medicare physician fee rule (CMS-1832-F) made small steps in this direction. Real change requires sustained rulemaking by Medicare, with the American Medical Association's pricing committee agreeing to systematic reweighting.
This is the highest-leverage policy lever available without legislation. It also faces the most organized opposition, because the procedural specialties whose income depends on the current weights have structured influence over that pricing committee.
Step 3: Expand WISeR-style targeted prior authorization on Schwartz-list services.
Here we need to be direct about how this relates to Issue #8.
Issue #8 documented a denial machine: commercial insurers applying blanket prior authorization to entitled care, using AI-generated denial as a margin tool, driving 3 million Medicare Advantage patients per year to forgo care they should have received. That was PA as a profit weapon.
What we recommend here is different in scope and governance. The WISeR Model targets 17 specific procedures where CMS has computed that clinical evidence does not support current utilization rates. The criteria are published and evidence-anchored. The oversight is federal, not insurer-internal. The physician specialty societies whose procedures appear on the Schwartz/WISeR lists largely agree that the evidence base is the right starting point for the discussion.
The distinction is: targeted, transparent, evidence-based PA by CMS on a short list of procedures with documented RCT evidence of low value, versus blanket PA applied by commercial insurers to all prior-authorization-eligible services with opaque review criteria and AI-generated denial.
Both use the phrase "prior authorization." They are not the same mechanism. The WISeR Q3 2026 readout will be the first empirical data on what government-administered targeted PA produces in practice.
Step 4: Shift procedure-heavy specialties to value-based payment.
The structural answer to a payment system that rewards volume is one that rewards outcomes. Medicare has been running pilots of "value-based" payment for over a decade: flat fees for entire episodes of care (BPCI Advanced), accountable-care groups that share in savings if their patients stay healthier (ACO REACH), per-patient monthly fees for primary care (Primary Care First). The CMS evaluations show modest but persistent savings without measurable quality losses.
The procedure mill is, at root, a payment-incentive problem. The procedure-heavy specialties most directly aligned with the Schwartz list (cardiology, orthopedics, gastroenterology, radiology) would look different under a payment model where the incentive is to deliver the right test to the right patient instead of to deliver more tests.
This is the most politically distant intervention and the only one that addresses the structural driver directly.
What's Next
Issue #11: The MA Overpayment.
MedPAC's March 2024 Report to Congress estimated that Medicare Advantage plans receive about $83 billion per year more than the same beneficiaries would cost in traditional Medicare. The mechanism: insurers send nurses into patients' homes specifically to find diagnoses, then bill Medicare for the higher-risk patient who is now "on the books" as having those conditions. The more conditions documented, the more Medicare pays the insurer for the rest of the year.
Issue #11 replicates the Kronick (JAMA Internal Medicine, 2022) coding-intensity methodology on current CMS HCC public data and extends it to the most recent enrollment year. We also track the qui tam settlement record: Kaiser Foundation Health Plan's $556 million settlement in 2026 for alleged upcoding, and ongoing DOJ investigations into UnitedHealth.
The MA overpayment story follows directly from the denial machine (#8) and the employer trap (#9): the same insurers collecting $83B in overpayments from Medicare also run the prior authorization machinery and manage the employer health plans. The arc is the same company, the same incentives, and three different ways of extracting margin.
Every script is on GitHub. Every number can be verified. If you think we got something wrong, open an issue: github.com/rexrodeo/american-healthcare-conundrum
If you found value in this work, forward it to someone who should see it.
Sources: Schwartz AL, Landon BE, Elshaug AG, Chernew ME, McWilliams JM, Measuring Low-Value Care in Medicare, JAMA Internal Medicine 174(7):1067-1076 (2014); Mafi JN, Russell K, Bortz B, Dachary M, Hazel WA, Fendrick AM, Low-Cost, High-Volume Health Services Contribute the Most to Unnecessary Health Spending, Health Affairs 36(10):1701-1704 (2017); Mafi JN, et al., Evaluation of US Trends in Low-Value Pediatric Health Services, JAMA Network Open 4(2):e2037328 (2021); Fleming JH, Doran T, Schwartz AL, et al., Low-Value Care Measurement: Testing Claims-Based Measures in an Integrated Health System, Journal of General Internal Medicine 37(4):869-875 (2022), SAS replication archive Harvard Dataverse DEW0UO; Kim DD, Fendrick AM, Projected Savings From Reducing Low-Value Services in Medicare, JAMA Health Forum 6(8):e253050 (August 2025); Lyu H, Xu T, Brotman D, Mayer-Blackwell B, Cooper M, Daniel M, Wick EC, Saini V, Brownlee S, Makary MA, Overtreatment in the United States, PLOS ONE 12(9):e0181970 (2017); Lown Institute, Lown Institute Hospitals Index 2021, Low-Value Care Methodology Report (2021); Choosing Wisely initiative, American Board of Internal Medicine Foundation, 600+ specialty society recommendations (campaign 2012-2023, archived); Mello MM, Chandra A, Gawande AA, Studdert DM, National Costs of the Medical Liability System, Health Affairs 29(9):1569-1577 (2010); Frakes MD, The Impact of Medical Liability Standards on Regional Variations in Physician Behavior: Evidence From the Adoption of National-Standard Rules, American Economic Review 103(1):257-276 (2013); Avraham R, Dafny LS, Schanzenbach M, The Impact of Tort Reform on Employer-Sponsored Health Insurance Premiums, Journal of Law, Economics and Organization (2012); Avraham R, Database of State Tort Law Reforms (DSTLR) 7th edition version 7.1 (University of Texas School of Law, 2021), https://law.utexas.edu/faculty/ravraham/; CMS Medicare Provider Utilization and Payment Data: Physician and Other Practitioners by Geography and Service, CY2023 (V20, released April 2025), data.cms.gov; CMS Hospital Outpatient PUF by Geography and Service, CY2023, data.cms.gov; CMS Medicare Geographic Variation HRR Public Use File CY2014-2021, data.cms.gov; CMS WISeR Model Provider and Supplier Operational Guide v5.0 (March 12, 2026), cms.gov/priorities/innovation; CMS WISeR Model Fact Sheet, cms.gov; CMS Calendar Year 2026 Medicare Physician Fee Schedule Final Rule (CMS-1832-F), CMS Newsroom Fact Sheets (November 2025); COURAGE Trial Writing Group, NEJM 356:1503-1516 (2007); ISCHEMIA Research Group, NEJM 382:1395-1407 (2020); Moseley JB et al., A Controlled Trial of Arthroscopic Surgery for Osteoarthritis of the Knee, NEJM 347:81-88 (2002); Gray A et al., CORAL Investigators, Renal-Artery Stenting versus Medical Therapy for Atherosclerotic Renal-Artery Stenosis (CORAL), NEJM 370:13-22 (2014); ASTRAL Investigators, Revascularization Versus Medical Therapy for Renal-Artery Stenosis, NEJM 361:1953-1962 (2009); ESCAPE Trial Investigators, Evaluation Study of Congestive Heart Failure and Pulmonary Artery Catheterization Effectiveness, JAMA 294:1625-1633 (2005); RAND Corporation, Employers' Forum of Indiana Hospital Price Transparency Study Round 5.1 (2023); MedPAC, March 2024 Report to Congress: Medicare Payment Policy; HCA Healthcare (HCA) FY2025 Form 10-K and 2026 DEF 14A, SEC EDGAR; Tenet Healthcare (THC) FY2025 Form 10-K and 2026 DEF 14A, SEC EDGAR; RadNet (RDNT) FY2025 Form 10-K and 2026 DEF 14A, SEC EDGAR; OpenSecrets.org, federal lobbying disclosure database (2020-2024 cycles).
Savings Tracker: $442.8 Billion and Counting
$442.8 billion per year in identified, booked, and recoverable waste across ten published issues of The American Healthcare Conundrum.
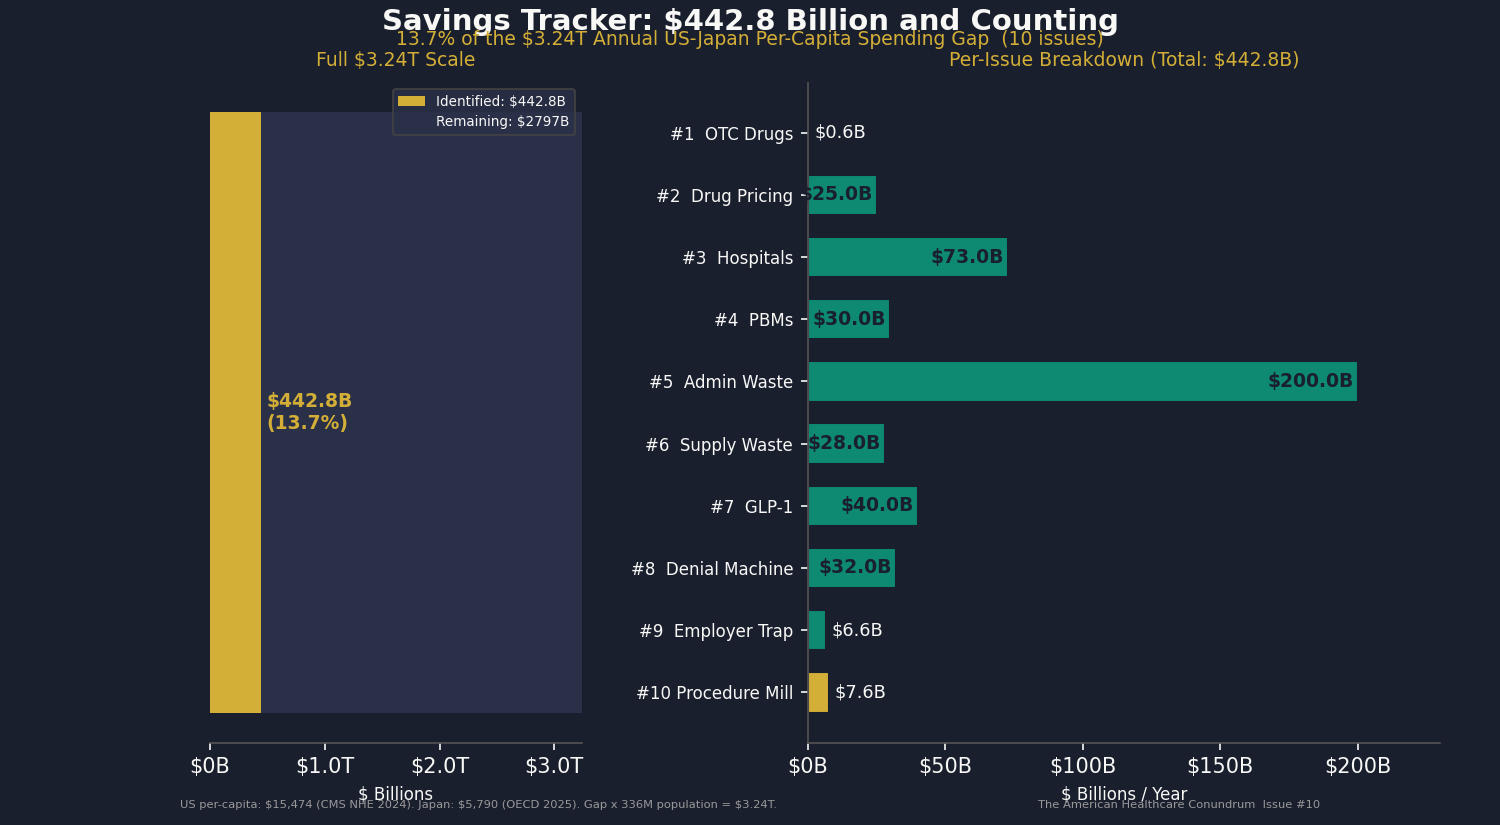
Issue #10 adds $7.6 billion from low-value Medicare and all-payer spending on a peer-reviewed list of 31 services that the evidence does not support for most patients. We used the CY2023 Medicare public use files and applied the published low-value-share multipliers from the Schwartz/Mafi/Choosing Wisely evidence base. The booked $7.6B reflects a Pass 3 methodology that corrected two methodological issues we found in our own earlier analyses (a $583M double-count, and an upward bias in our averaging step). Range high is $13.6B. The gap between $7.6B and Lown's $75-100B macro estimate is explained in the issue body and is the explicit data-partner recruitment ask.
Methodology notes for all published issues:
Issue #1 OTC Drugs: $0.6B from Part D coverage of brand drugs with OTC equivalents; CMS Part D Public Use File 2023, step-therapy crosswalk analysis.
Issue #2 Drug Pricing: $25.0B from 9 top-spend Medicare brand drugs versus international prices; CMS Part D PUF 2023, NHS Drug Tariff (March 2026), RAND RRA788-3, Peterson-KFF. Net-adjusted at 49% rebate for top-spend brand drugs.
Issue #3 Hospital Pricing: $73.0B from commercial reference pricing at 200% of Medicare (currently at 254%); RAND Round 5.1, CMS HCRIS FY2023 (3,193 hospitals), CMS NHE 2023.
Issue #4 PBMs: $30.0B from PBM spread pricing, rebate retention, and biosimilar non-adoption gap; FTC Interim Reports I and II, Ohio Auditor data, CMS Part D PDE.
Issue #5 Admin Waste: $200.0B from structural billing complexity and prior auth processing cost; Woolhandler/Himmelstein updated 2023, HCRIS admin variance (4,518 hospitals), AMA PA Survey 2024.
Issue #6 Supply Waste: $28.0B from hospital supply cost variance (Q4 to P75 within peer groups); CMS HCRIS FY2023 Worksheet A (5,480 hospitals).
Issue #7 GLP-1 Pricing: $40.0B from US-to-international price gap in GLP-1 receptor agonists and BALANCE model optimization; CMS NHE, OECD, Novo Nordisk and Eli Lilly filings.
Issue #8 Denial Machine: $32.0B from prior authorization reform ($10.4-17.0B care suppression), vertical integration restrictions ($6.7-13.8B margin arbitrage), AI regulation ($4.9-6.4B denial escalation), and MA risk adjustment audits ($0.3B); CMS-0057-F, KFF CY2024 Part C data, Health Affairs 2025.
Issue #9 Employer Trap: $6.6B from above-benchmark broker compensation and above-peer admin-fee variance in ERISA health welfare plans; DOL Form 5500 Schedule A and Schedule C 2023 research file. Plan-level analysis of post-CAA 2021 disclosures.
Issue #10 Procedure Mill: $7.6B from low-value Medicare and all-payer spending on a peer-reviewed 31-service list, applied to CY2023 Medicare public use files. Sources include CMS Provider Utilization, Hospital Outpatient, Physician/Supplier, and Geographic Variation files; the Schwartz/Mafi/Mathematica replication archive at Harvard Dataverse; the Avraham State Tort Law Reforms database; and the BLS Medical Care CPI series. Range $7.6-13.6B; data-partner ask is for restricted Medicare data, licensed commercial claims, or state all-payer claims databases.
Denominator: $3.24 trillion US-Japan per-capita spending gap (US per-capita $15,474, Japan $5,790, US population ~336 million; CMS NHE 2024 final, OECD Health at a Glance 2025). The running total at $442.8B represents 13.7 percent of the $3.24T gap.
The American Healthcare Conundrum publishes when the data is ready. All analysis uses publicly available data. Code is open-source. Figures are validated before publication.